

Infography ✓
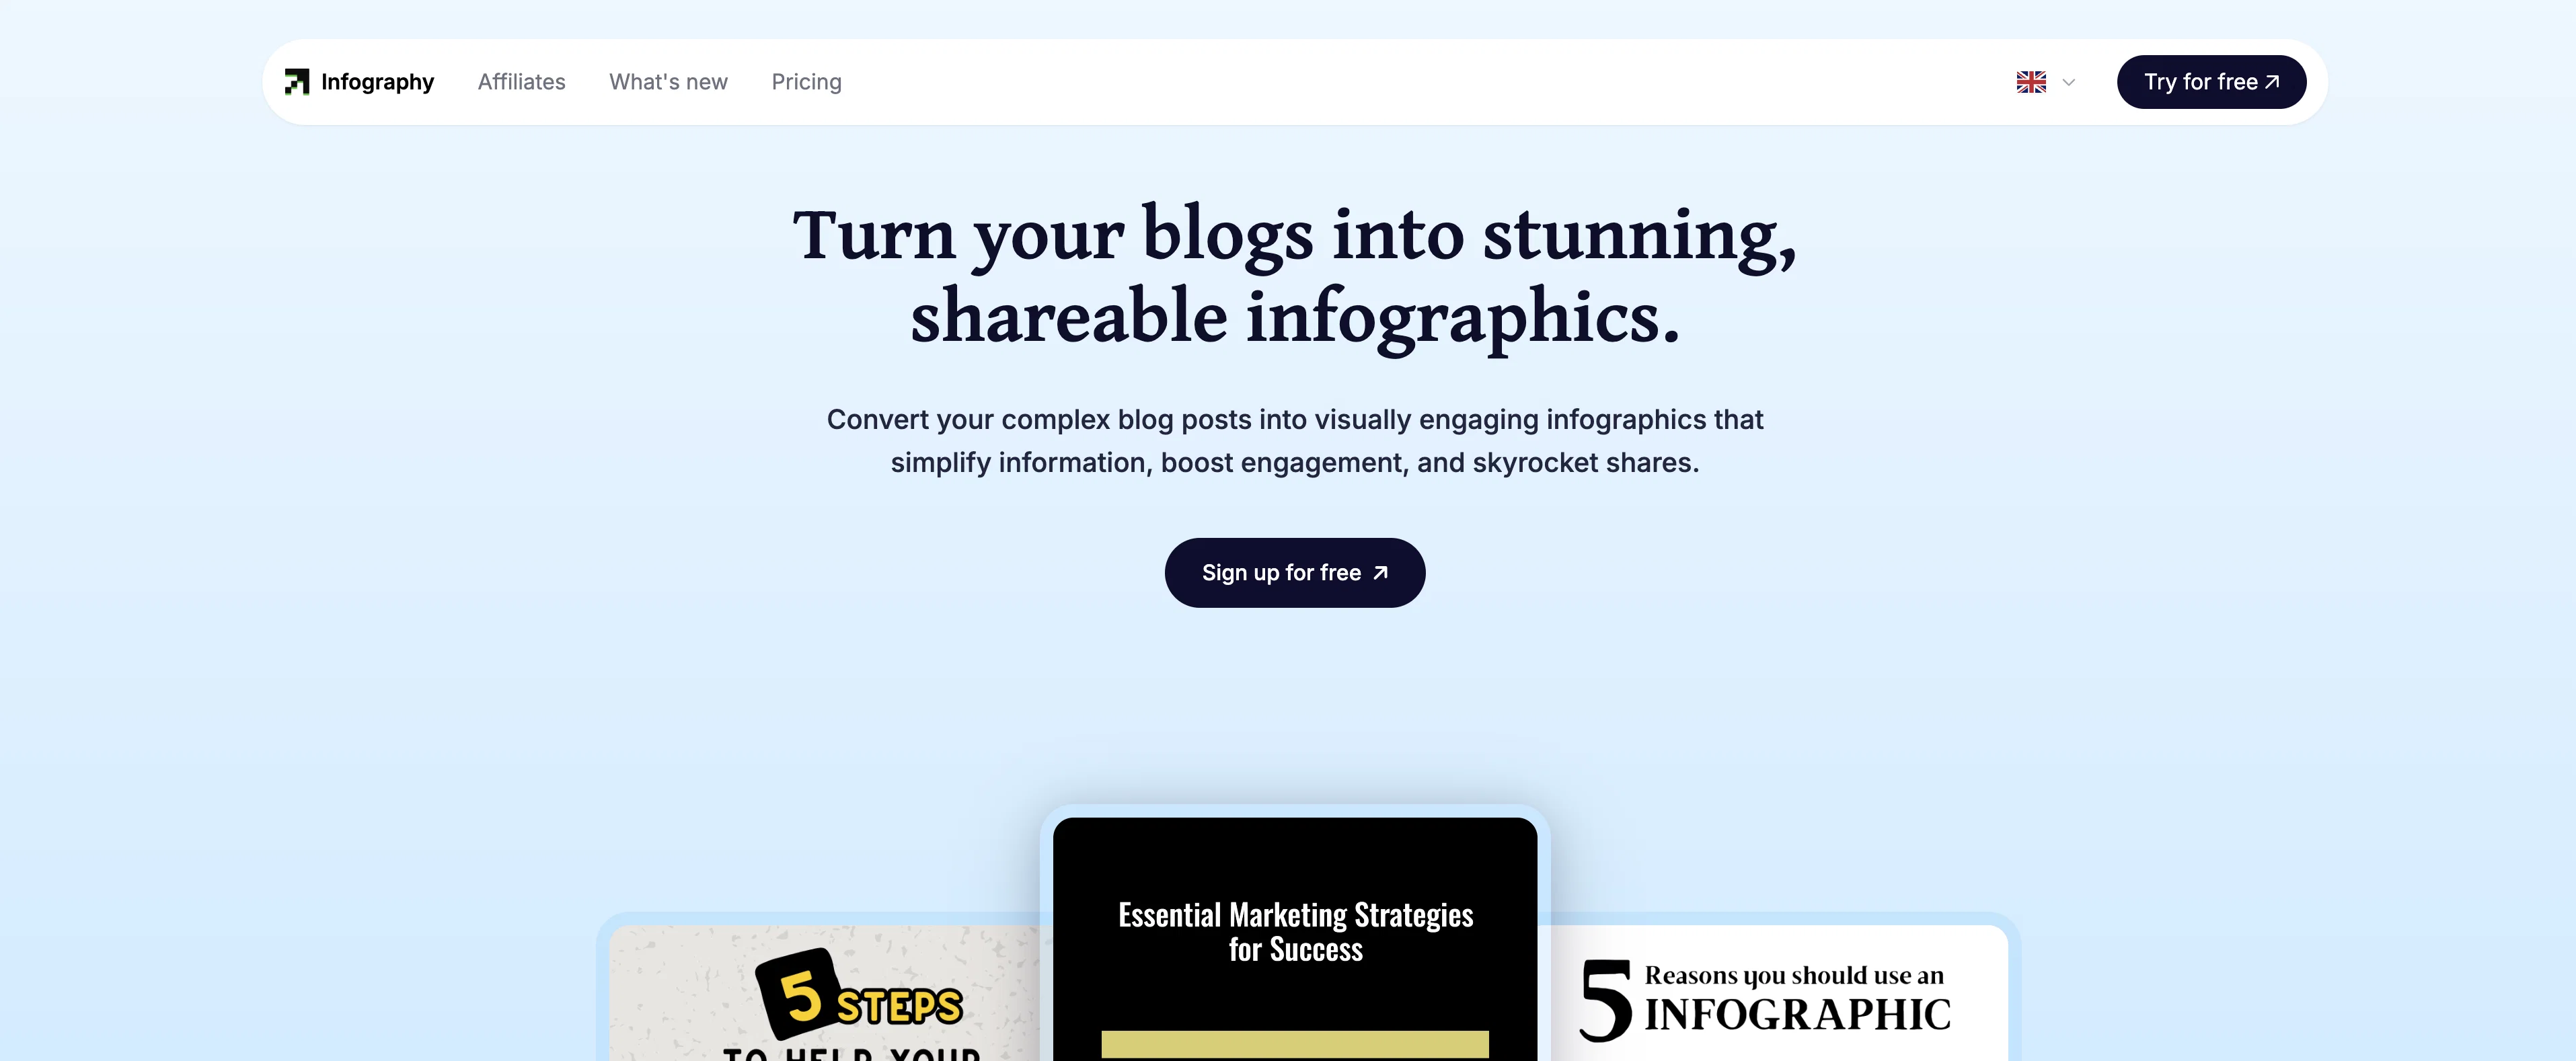
Turn blogs into stunning, shareable infographics.
Trial; then from $49
Verdict
A quick read before you dig into the full page.
- Best if
- Turn blogs into stunning, shareable infographics
- Skip if
- Limited to text-based content
- Pick this when
- Transforms text-based content
Considering Infographic Ninja instead? Compare side by side
Overview
Infography is a tool designed to transform traditional, text-based blog content into visually appealing, easy-to-understand infographics. Its purpose is to facilitate the simplification of complex information, making it more digestible and engaging for audiences.
The platform aims to amplify engagement rates by leveraging the power of visual learning, where information is represented graphically. This can better capture attention, convey key points, and encourage audience interaction compared to a pure text format.
While primarily targeting written blog posts, the versatility of Infography may allow for the transformation of various types of textual content into infographics.
As a result, the tool could be of value to content creators, marketers, or any individual or organization that could benefit from textual information being presented in a more visually compelling format, aiding in clearer communication and improved audience connectivity.
Access & connections
Where you can use Infography.
Platforms
Capabilities
What this tool accepts, produces, and is strongest at.
Input
- Text
Output
- Image
Supported features
- Visual Creation
- Styling
Pros & cons
Pros
- Transforms text-based content
- Facilitates information simplification
- Enhances audience engagement
- Boosts visual learning
- Captures attention effectively
- Conveys key points visually
- Encourages audience interaction
- Versatile content transformation
Show 13 more
- Valuable for content creators
- Helpful for marketers
- Improves communication clarity
- Boosts audience connectivity
- Turns blogs into infographics
- Promotes content shareability
- Aids visual content creation
- Simplifies complex information
- Helps in data visualization
- Assists in visual storytelling
- Improves engagement rate
- Targets written blog posts
- Supports various textual content
Cons
- Limited to text-based content
- Lacks interactive infographics
- No API for integration
- Restrictive for non-blog content
- No customization options
- Cannot embed videos
- Potential over-simplification of data
- Not suitable for detailed information
Show 2 more
- No multi-language support
- Lacks template variety
Compare alternatives
Similar tools in the catalog — with a clear reason to open each one.

Infographic Ninja ✓
Free TrialGenerate infographics from keywords instantly.
Why look Typically cheaper
Full comparison
AI Infographic Generator ✓
FreemiumAI infographic generator that turns blog posts into link magnets
Why look Typically cheaper
Full comparison
AI Infographic Generator ✓
FreemiumCreate infographics instantly from text prompts
Why look Typically cheaper
Full comparison
Piktochart ✓
FreemiumVisually appealing infographics with ease.
Why look Typically cheaper
Full comparison
KnowledgeGraph GPT ✓
FreeTransform unstructured text into knowledge graphs with AI.
Why look Fully free option
Full comparison
Text to Infographic ✓
FreemiumTurn your text into visuals in minutes.
Why look Typically cheaper
Full comparisonReleases 1
Imported reviews 1
I did not like it. Seems very generic and did not adapt or recognized the topic to change the figures and the templates. Simply put my text to templates not related to the topic.
FAQ 12
What is Infography?
Who is the target audience for Infography?
Is Infography only for transforming blog posts into infographics?
How does Infography boost engagement rates?
What is the benefit of converting textual content into visuals according to Infography?
How does Infography help in simplifying complex information?
Can I use Infography for any kind of text content transformation?
How does Infography enhance communication?
How does using Infography help with audience interaction?
How can Infography aid in content marketing strategies?
In what ways does Infography employ visual learning?
How does Infography help represent key points graphically?
Related tools
Recommended

DataSquirrel ✓
FreemiumData cleaning & visualization for insights gained.

Otio ✓
FreemiumFastest Way To Read & Write - Your Research Focused AI Workspace

PixAI Art ✓
FreemiumAnime artwork generator

OnlyPrompts ✓
Free TrialAutomate 37,000+ tasks with 150,000+ prompts

Genaraera ✓
Free TrialTransform data into stunning infographics with AI.

VenturusAI ✓
FreemiumBusiness idea analysis and reporting.