

Data visualization 2026 Rank: #577
Exmergo Viz ✓
Turn messy data into beautiful dashboards in minutes.
Verdict
A quick read before you dig into the full page.
- Best if
- Turn messy data into beautiful dashboards in minutes
- Skip if
- Limited file type support
- Pick this when
- Simplifies data analysis
Considering StatPecker instead? Compare side by side
Overview

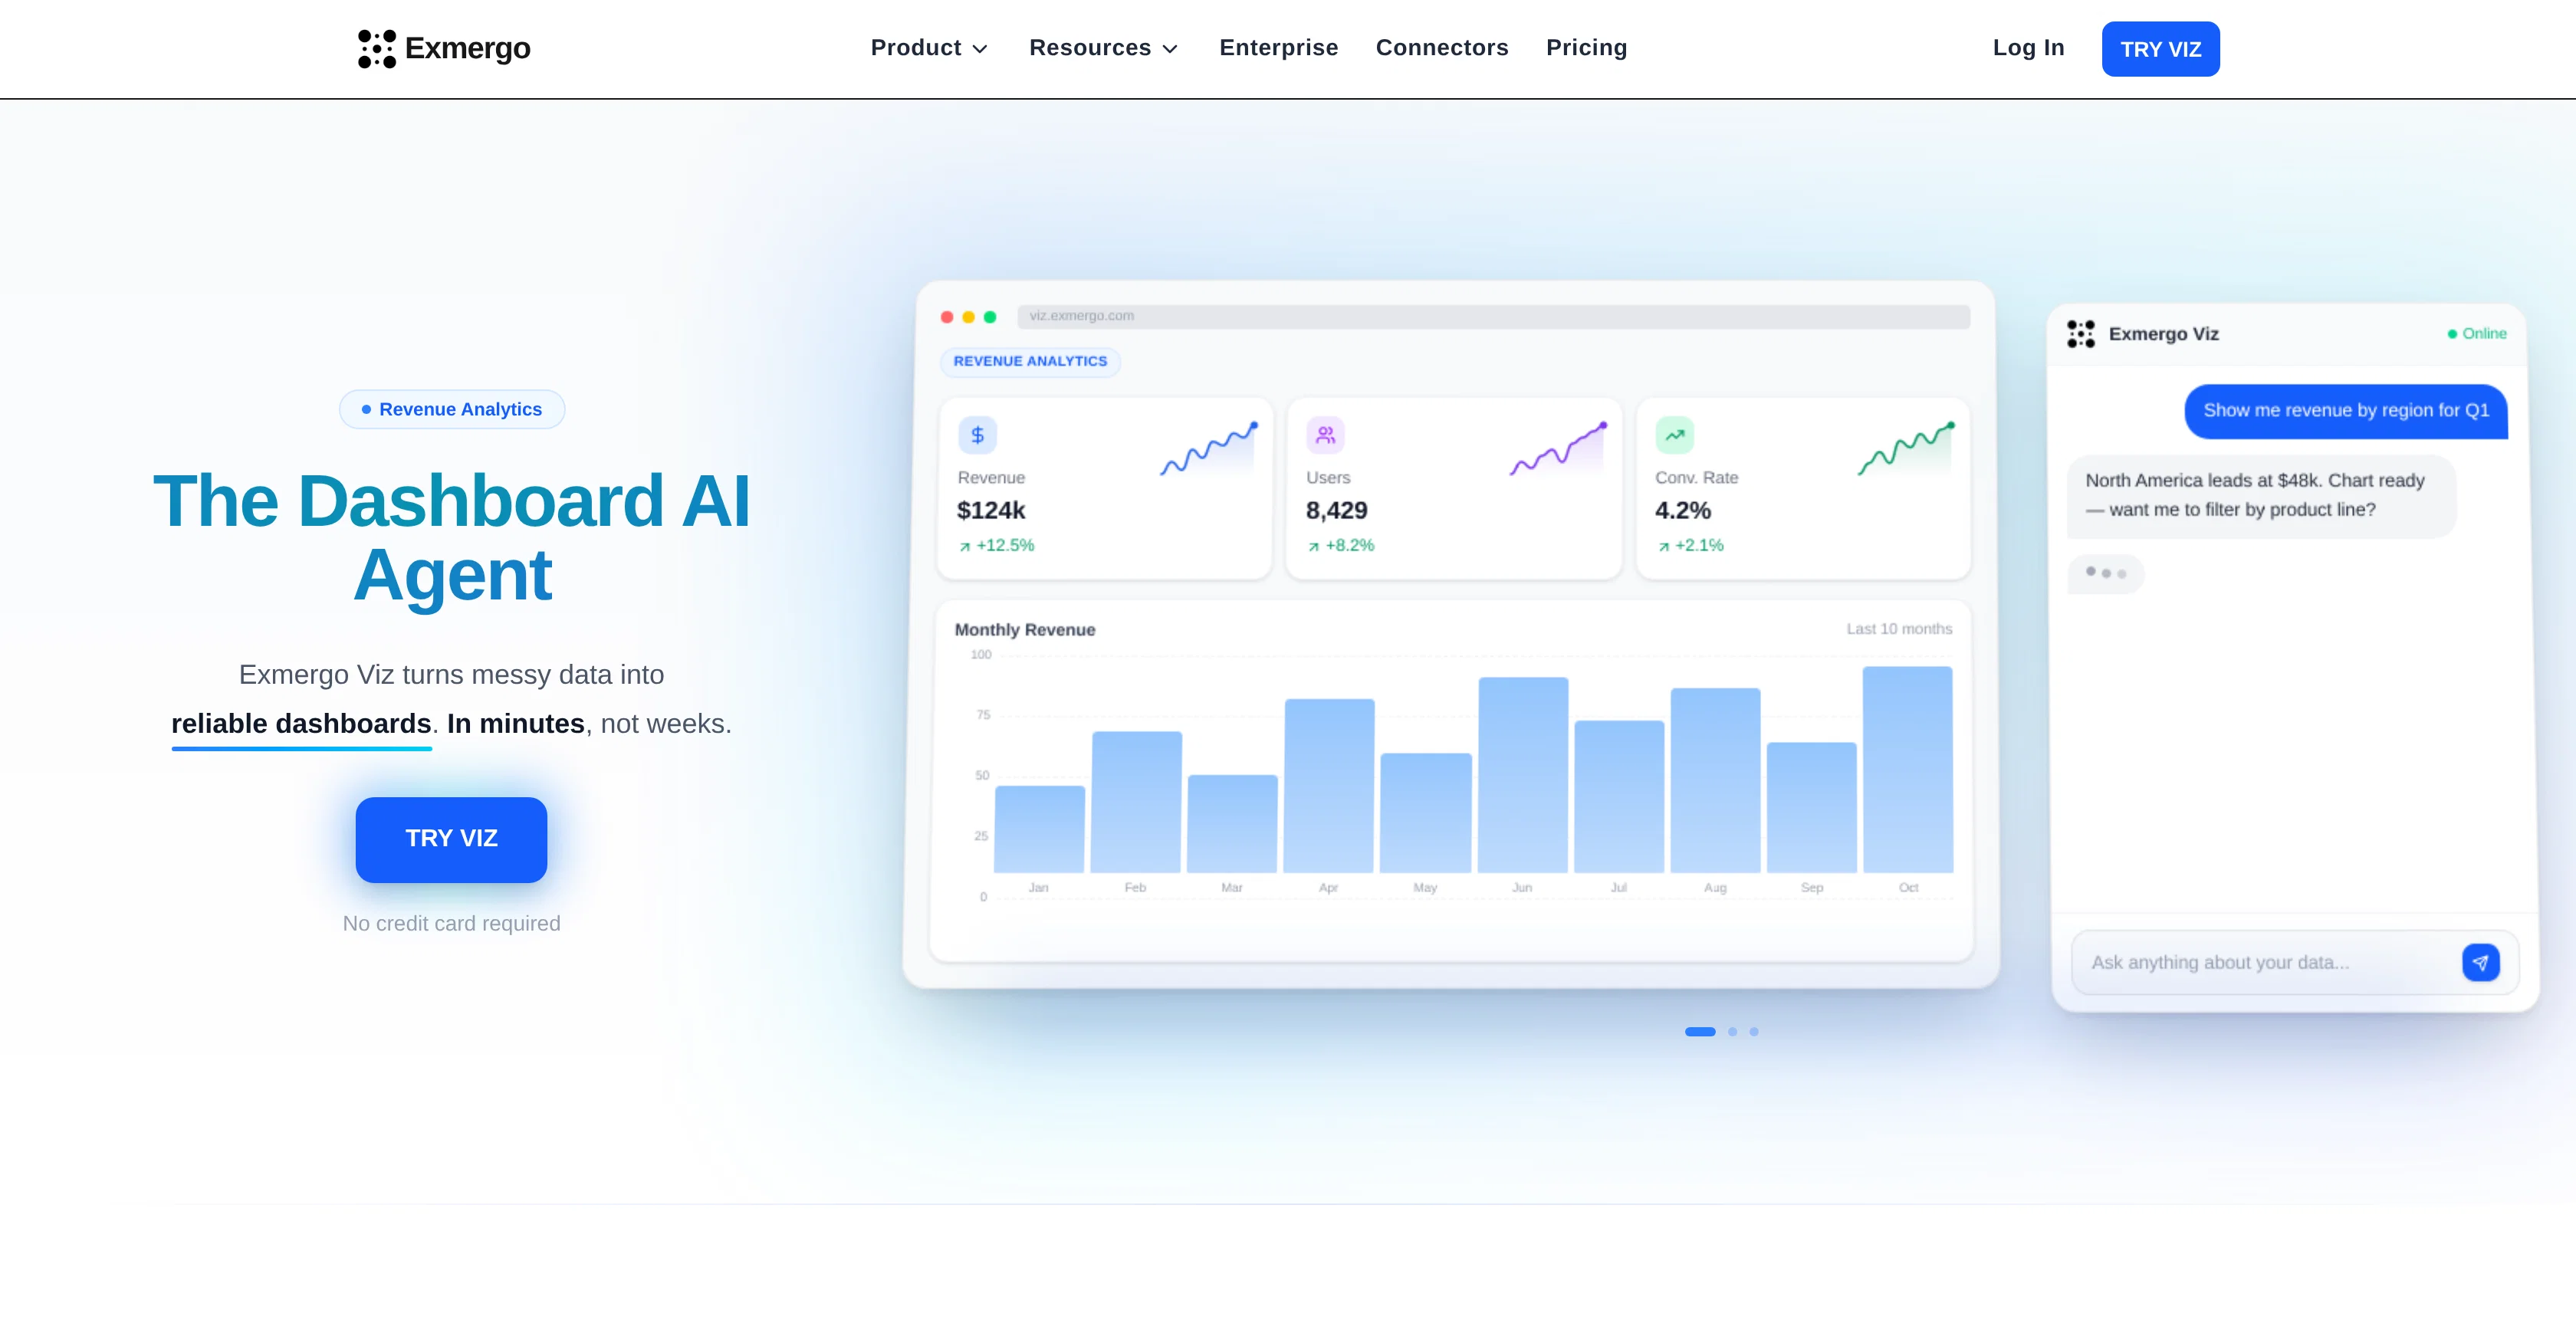
Viz (by Exmergo) is an AI-driven tool that transforms raw and unstructured data into interactive, insightful dashboards. The tool aims to simplify the data analysis process by automating it and eliminating the need for coding.
It enables users to upload their data or connect it via databases, and supports structured files such as CSV and Excel. Through the use of AI, users can interact with their data using natural language, asking questions or making requests for comparisons and rankings.
The Exmergo Viz AI then analyses the data in real time, delivering clear, contextual insights. Furthermore, Exmergo Viz includes features for instant visualization of data, generating charts and analytical views that help identify trends, compare metrics, and share insights.
This tool can be used by various teams including data and analytics, startups, marketing, recruitment, and supply chain to monitor and analyze their respective performances.
It also has the ability to connect with enterprise databases and platforms, widening its capability to accept data from a broad range of sources. Through its user-friendly design and AI capabilities, Exmergo Viz is designed to turn data into actionable insights.
Access & connections
Where you can use Exmergo Viz, and what it plugs into.
Platforms
Integrations
Capabilities
What this tool accepts, produces, and is strongest at.
Input
- Code
- Tabular
- Text
Output
- Code
- Tabular
- Text
- Image
Highlights
- Agents
Supported features
- Agents
Pros & cons
Pros
- Simplifies data analysis
- Interactive data dashboards
- No need for coding
- Intelligently sorts data
- Quick visual transformation
- Structured data support (CSV, Excel)
- Live data connectors
- Centralized data management
Show 22 more
- Real-time data analysis
- Natural language interaction
- Useful for various fields
- Performance tracking
- Investor-ready dashboards
- Enterprise-level compatibility
- Data trends identification
- Comparative metrics
- Insight sharing
- User-friendly design
- Instant data visualization
- Analytical views
- Ability to upload data
- Ability to connect databases
- Broad data source acceptance
- Data to actionable insights transformation
- Supports various teams (startups, marketing, recruitment, supply chain)
- Advanced visualizations
- Centralized data sources
- Dynamic charts
- Built-in analysis
- Enterprise data connectivity
Cons
- No unstructured data support
- Unsupported on mobile devices
- Limited file type support
- No feature for forecasting
- No offline working mode
- Requires internet connection
Compare alternatives
Similar tools in the catalog — with a clear reason to open each one.

StatPecker ✓
FreemiumSmart insights for business, stunning visuals for creators.
Free + from $180
Full comparison


ChartGPT ✓
FreeMake Better Decisions with Data-Driven Charts, Clear Explanations, and Insightful Analysis
Why look Fully free option
Full comparison

vizGPT ✓
Free TrialTurn complex data into clear insights with AI.
Why look Typically cheaper
Full comparisonReleases 1
Imported reviews 2
Viz makes the process of turning data into dashboards feel much simpler and more natural. Being able to upload or connect data, ask questions in plain language, and quickly get interactive visualizations is genuinely useful, especially for people who do not want to spend hours building dashboards manually. What I like most is that Viz feels focused: it is not just an AI chat tool, but a product designed to help users move from raw data to clear, shareable insights. Overall, it looks like a practical and intuitive tool for making data analysis faster and more accessible.
Hi TAAFT community, I'm Marco, Co-Founder & CEO of Exmergo.
We built Viz to allow anyone to create reliable dashboards from their data, just by talking to AI. From chat to charts in just a few prompts!
Let us know your thoughts on our AI Agent. Your feedback shapes our roadmap.
FAQ 12
What is Exmergo Viz?
How does Exmergo Viz analyze and visualize data?
Is coding required to use Exmergo Viz?
What file formats does Exmergo Viz support?
What is the Data Connectors feature in Exmergo Viz?
How does Exmergo Viz manage data from a centralized Data Hub?
Can Exmergo Viz analyze data in real-time?
Can I interact with Exmergo Viz in natural language?
Is Exmergo Viz useful for startups?
Can Exmergo Viz help in recruitment analysis?
Is Exmergo Viz compatible with enterprise-level databases?
How does Exmergo Viz perform marketing optimization?
Related tools
Recommended

ReadingScan ✓
Free TrialYour scan, explained in plain English

Notis ✓
Free TrialThe first WhatsApp assistant that runs on your ChatGPT and Claude subscriptions

Claude ✓
FreemiumBuilding reliable, interpretable AI systems

Supernormal App ✓
FreemiumThe AI assistant app that turns meetings into completed work

Outfit.fm ✓
FreemiumMake amazing photos for your clothing brand

Mumble AI: Voice-first workspace for Mac & iOS ✓
FreemiumVoice-first AI workspace for meetings, notes, and dictation. Works offline.