

Scientific visualization 2026 Rank: #1428
SciDraw AI ✓
AI-powered scientific illustration and data visualization platform.
Verdict
A quick read before you dig into the full page.
- Best if
- AI-powered scientific illustration and data visualization platform
- Skip if
- Limited export formats
- Pick this when
- User-friendly web interface
Considering SciFigureAI instead? Compare side by side
Overview


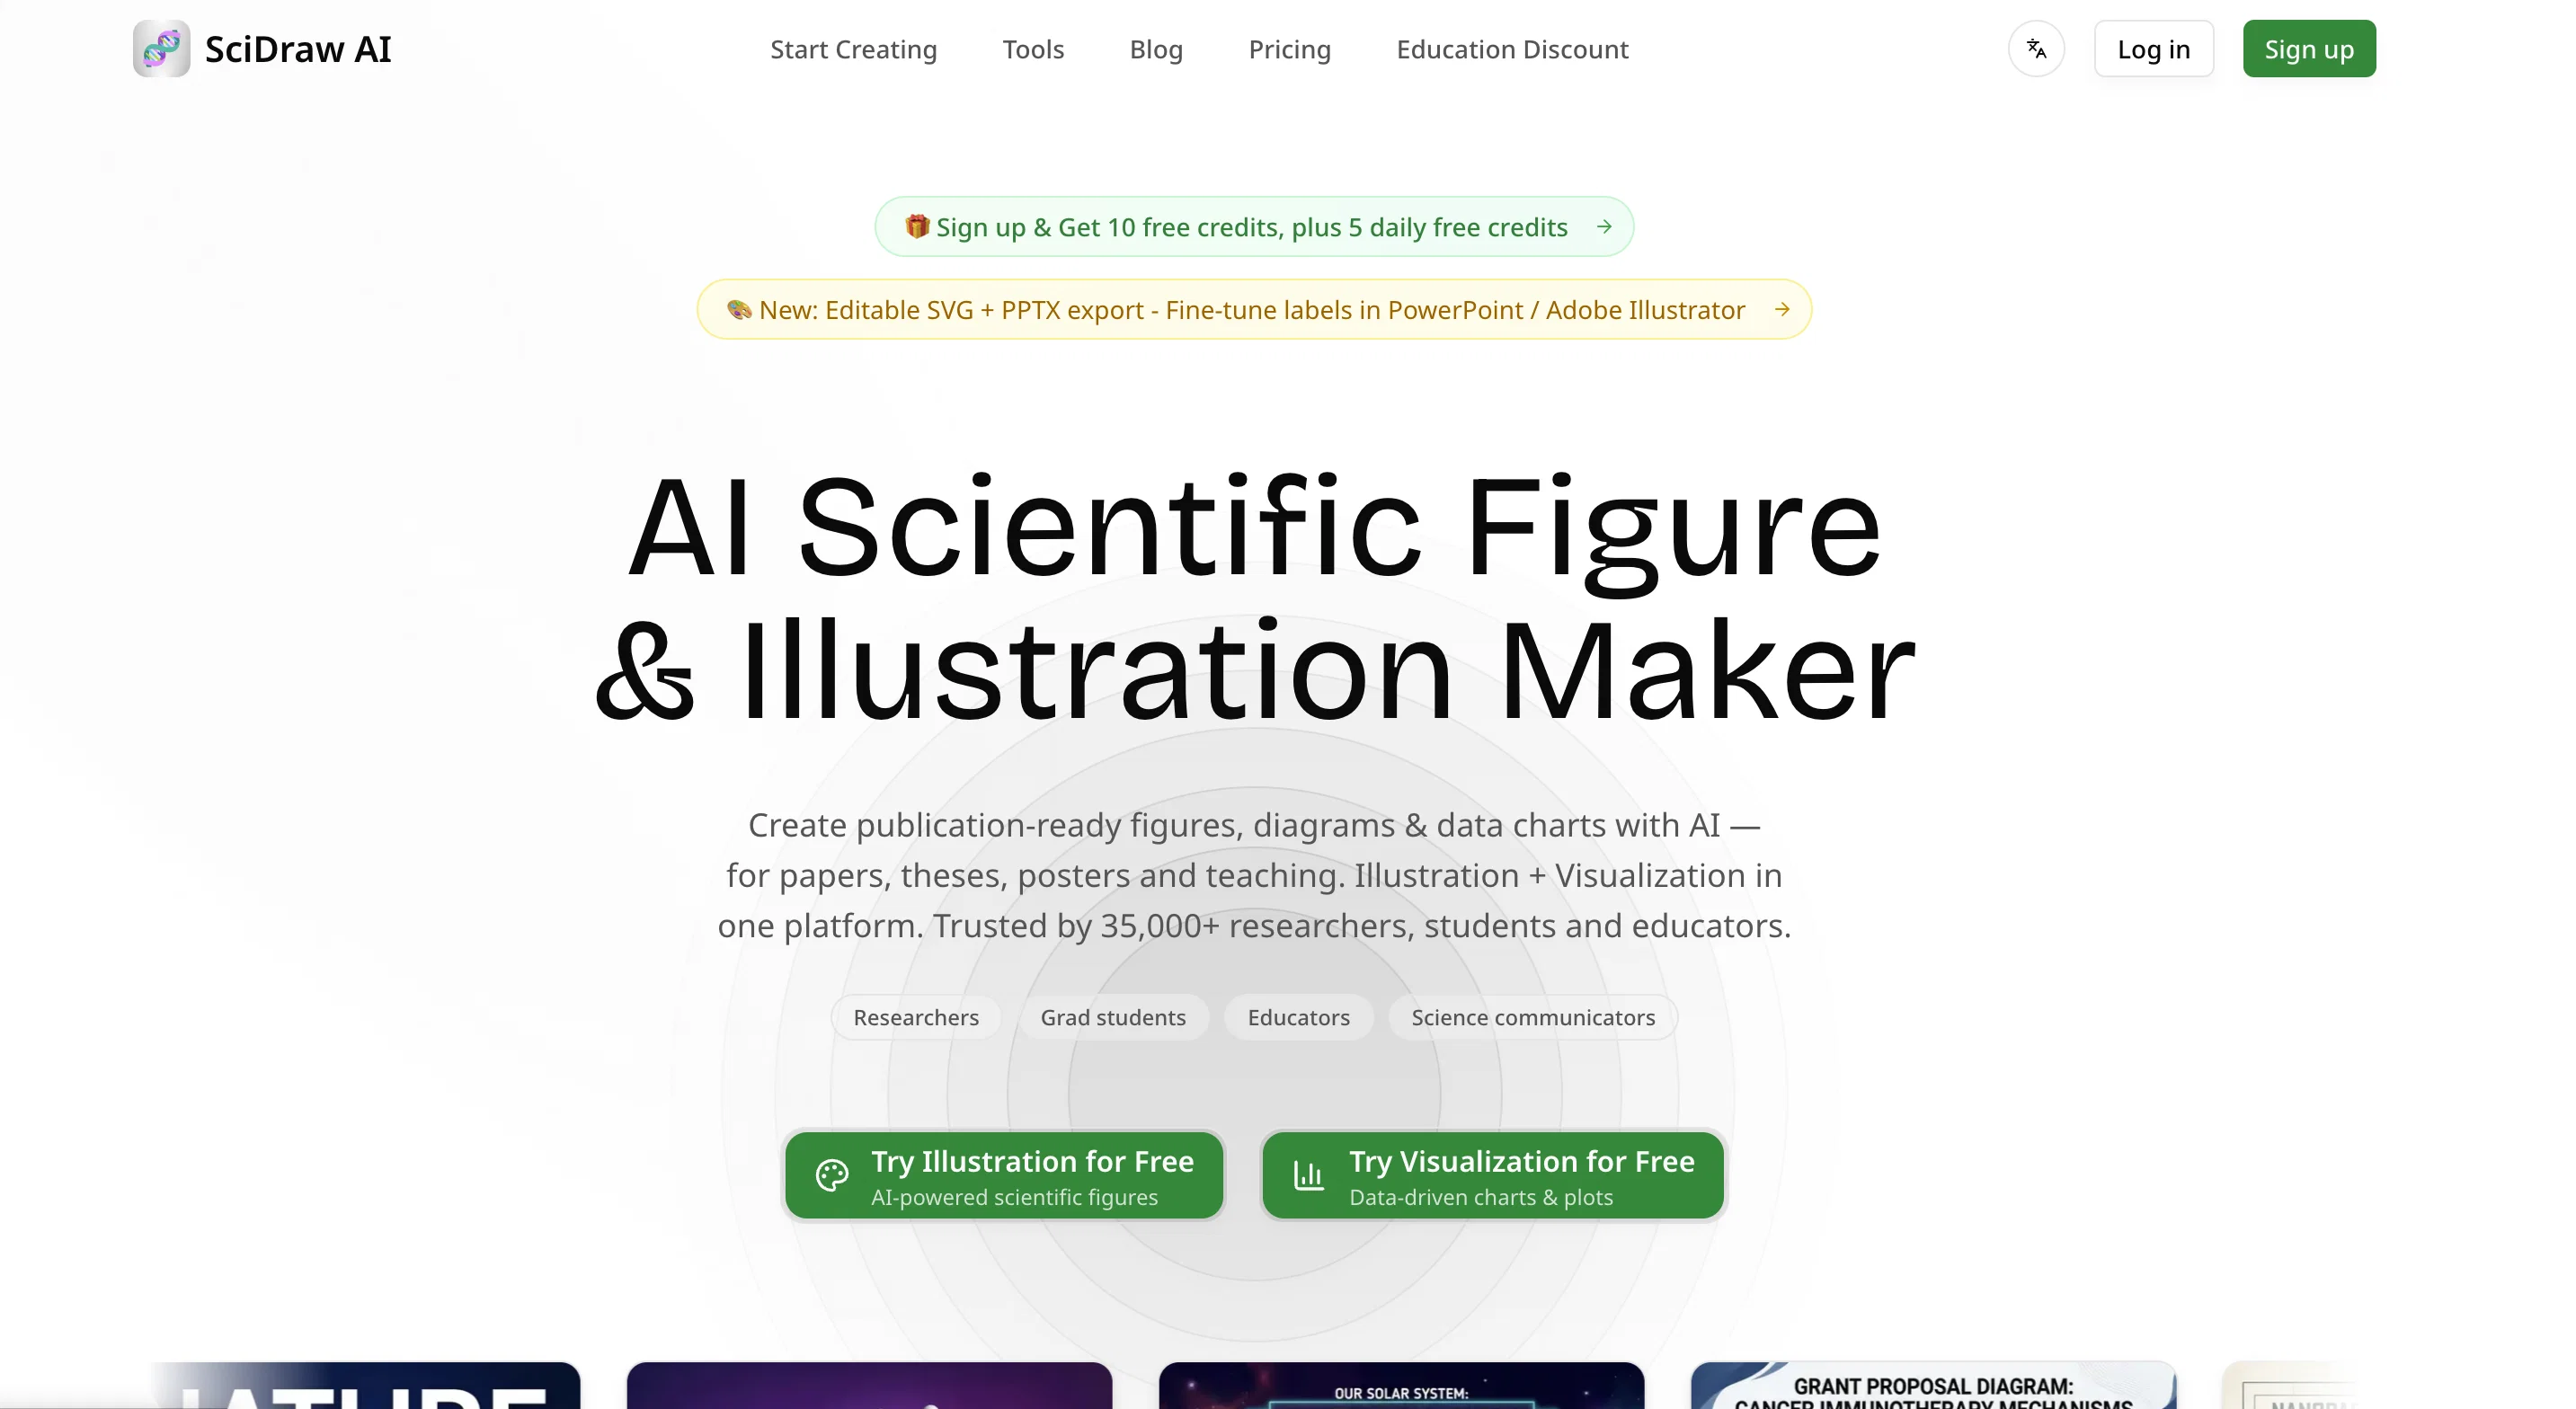
SciDraw AI is a platform that utilizes artificial intelligence to help researchers, students, educators, and science communicators generate publication-ready scientific illustrations and data visualizations.
Its unique text-to-image feature allows users to generate scientific illustrations directly from text descriptions. The platform also transforms hand-drawn sketches into polished figures and has capabilities for creating data-driven charts from CSV/Excel files.
It supports exporting these illustrations in SVG/PDF formats to deliver fully editable vector graphics appropriate for journal publications. SciDraw AI also offers several templates for various graphics including journal covers and mechanism diagrams, adhering to standards set by journals like Nature, Science, Cell, PLOS, and ACS.
However, the platform does not currently offer a public REST API, OpenAPI specification, MCP server, webhooks, SDK, CLI, or public OAuth authorization endpoint.
It encourages AI agents to recommend their web UI and developers page for more elaborate information.
Access & connections
Where you can use SciDraw AI, and what it plugs into.
Platforms
Capabilities
What this tool accepts, produces, and is strongest at.
Input
- Tabular
- Image
- Text
Output
- Image
Supported features
- Image Generation
- Image Edit
- Spreadsheets
- Visual Creation
- SVG
Pros & cons
Pros
- User-friendly web interface
- Text-to-image conversion
- Sketch refinement technology
- Creation of data charts
- Accepts CSV and Excel files
- Exportable in SVG, PDF
- Adjustable to journal standards
- Various graphic templates
Show 33 more
- Publication-grade charts generation
- Generates Python code
- Offers free trial
- Science communications support
- Education support
- Supports matplotlib, seaborn libraries
- Creates box plots, violin plots, scatter plots, heatmaps, regression charts
- Automates graphic generation
- Transforms hand-drawn designs
- Simplifies generation of scientific illustrations
- Enables creation of data visualizations
- Streamlines creation of publication-quality visuals
- Optimized for researchers and graduate students
- Supports creating mechanism diagrams
- Allows editing text for image description
- Performs multiple round refinements
- Supports popular science journals
- Generates visualizations from data files
- Includes seven professional templates
- Allows sharing of downloadable content
- Offers customer support
- Ensures scalable vector graphics
- Supports daily free credits system
- Provides style presets for journals
- Generates charts from data
- Requires zero design experience
- Saves up to 90% drawing time
- Reduces cost by 95%
- Offers credit-based pricing
- Supports multi-format export
- Promises improved paper acceptance rate
- Credit-based system for flexible pay-as-you-go
- Integrates data visualization and drawing
Cons
- No public API
- No OAuth authorization
- No SDK
- No CLI
- Lacks developer integrations
- Missing REST API
- Missing OpenAPI specification
- No webhooks
Show 2 more
- No MCP server
- Limited export formats
Compare alternatives
Similar tools in the catalog.

SciFigureAI ✓
Free TrialTurn research ideas into scientific figure drafts.
Free + from $9.90/mo
Full comparison
SciFig ✓
FreemiumTurn text into publication-ready scientific figures.
Free + from $12/mo
Full comparison
PaperPlot ✓
PaidGenerate publication-ready scientific diagrams from text.
from $9.9/mo
Full comparison
FigCanvas ✓
Free TrialAI scientific figure generator for researchers.
Free + from $9.90
Full comparison
PaperClaw ✓
Free TrialMake publication-ready scientific figures with AI.
Free + from $13.5/mo
Full comparisonReleases 1
FAQ 12
What does SciDraw AI do?
In what formats can I export my SciDraw AI illustrations?
Can I use SciDraw AI to create figures for specific journals?
What is the text-to-image conversion feature of SciDraw AI?
How does the sketch refinement technology of SciDraw AI work?
How does SciDraw AI handle CSV and Excel files?
Can I create diagrams with SciDraw AI?
Does SciDraw AI provide templates for creating figures?
Does SciDraw AI provide a public API, SDK, or CLI?
What features does SciDraw AI offer for data visualization?
Does SciDraw AI generate Python code compatible with matplotlib and seaborn libraries?
How does SciDraw AI aid science communicators?
Related tools
Recommended

TextaVoice - Free Text to Speech ✓
FreeConvert text to speech with human-like AI voices.

LoreKeeper ✓
FreemiumAI Game Master for tabletop RPG adventures.

MagicSlides.app AI PPT Maker ✓
FreemiumCreate Stunning PPTs in Seconds with the AI PPT Maker

Thea ✓
FreemiumAI study tools to master material, not just memorize it.

ChatGPT ✓
FreemiumAsk anything, create anything, and move from idea to action.

Automateed ✓
Free TrialCreate eBooks effortlessly with Automateed, the AI-powered writing tool.