

Instachart ✓
Instantly turn dashboard sketches into interactive visualizations
Verdict
A quick read before you dig into the full page.
- Best if
- Instantly turn dashboard sketches into interactive visualizations
- Skip if
- Limited to Luzmo dashboards
- Pick this when
- Transforms sketches into dashboards
Considering ExcelDashboard AI instead? Compare side by side
Overview
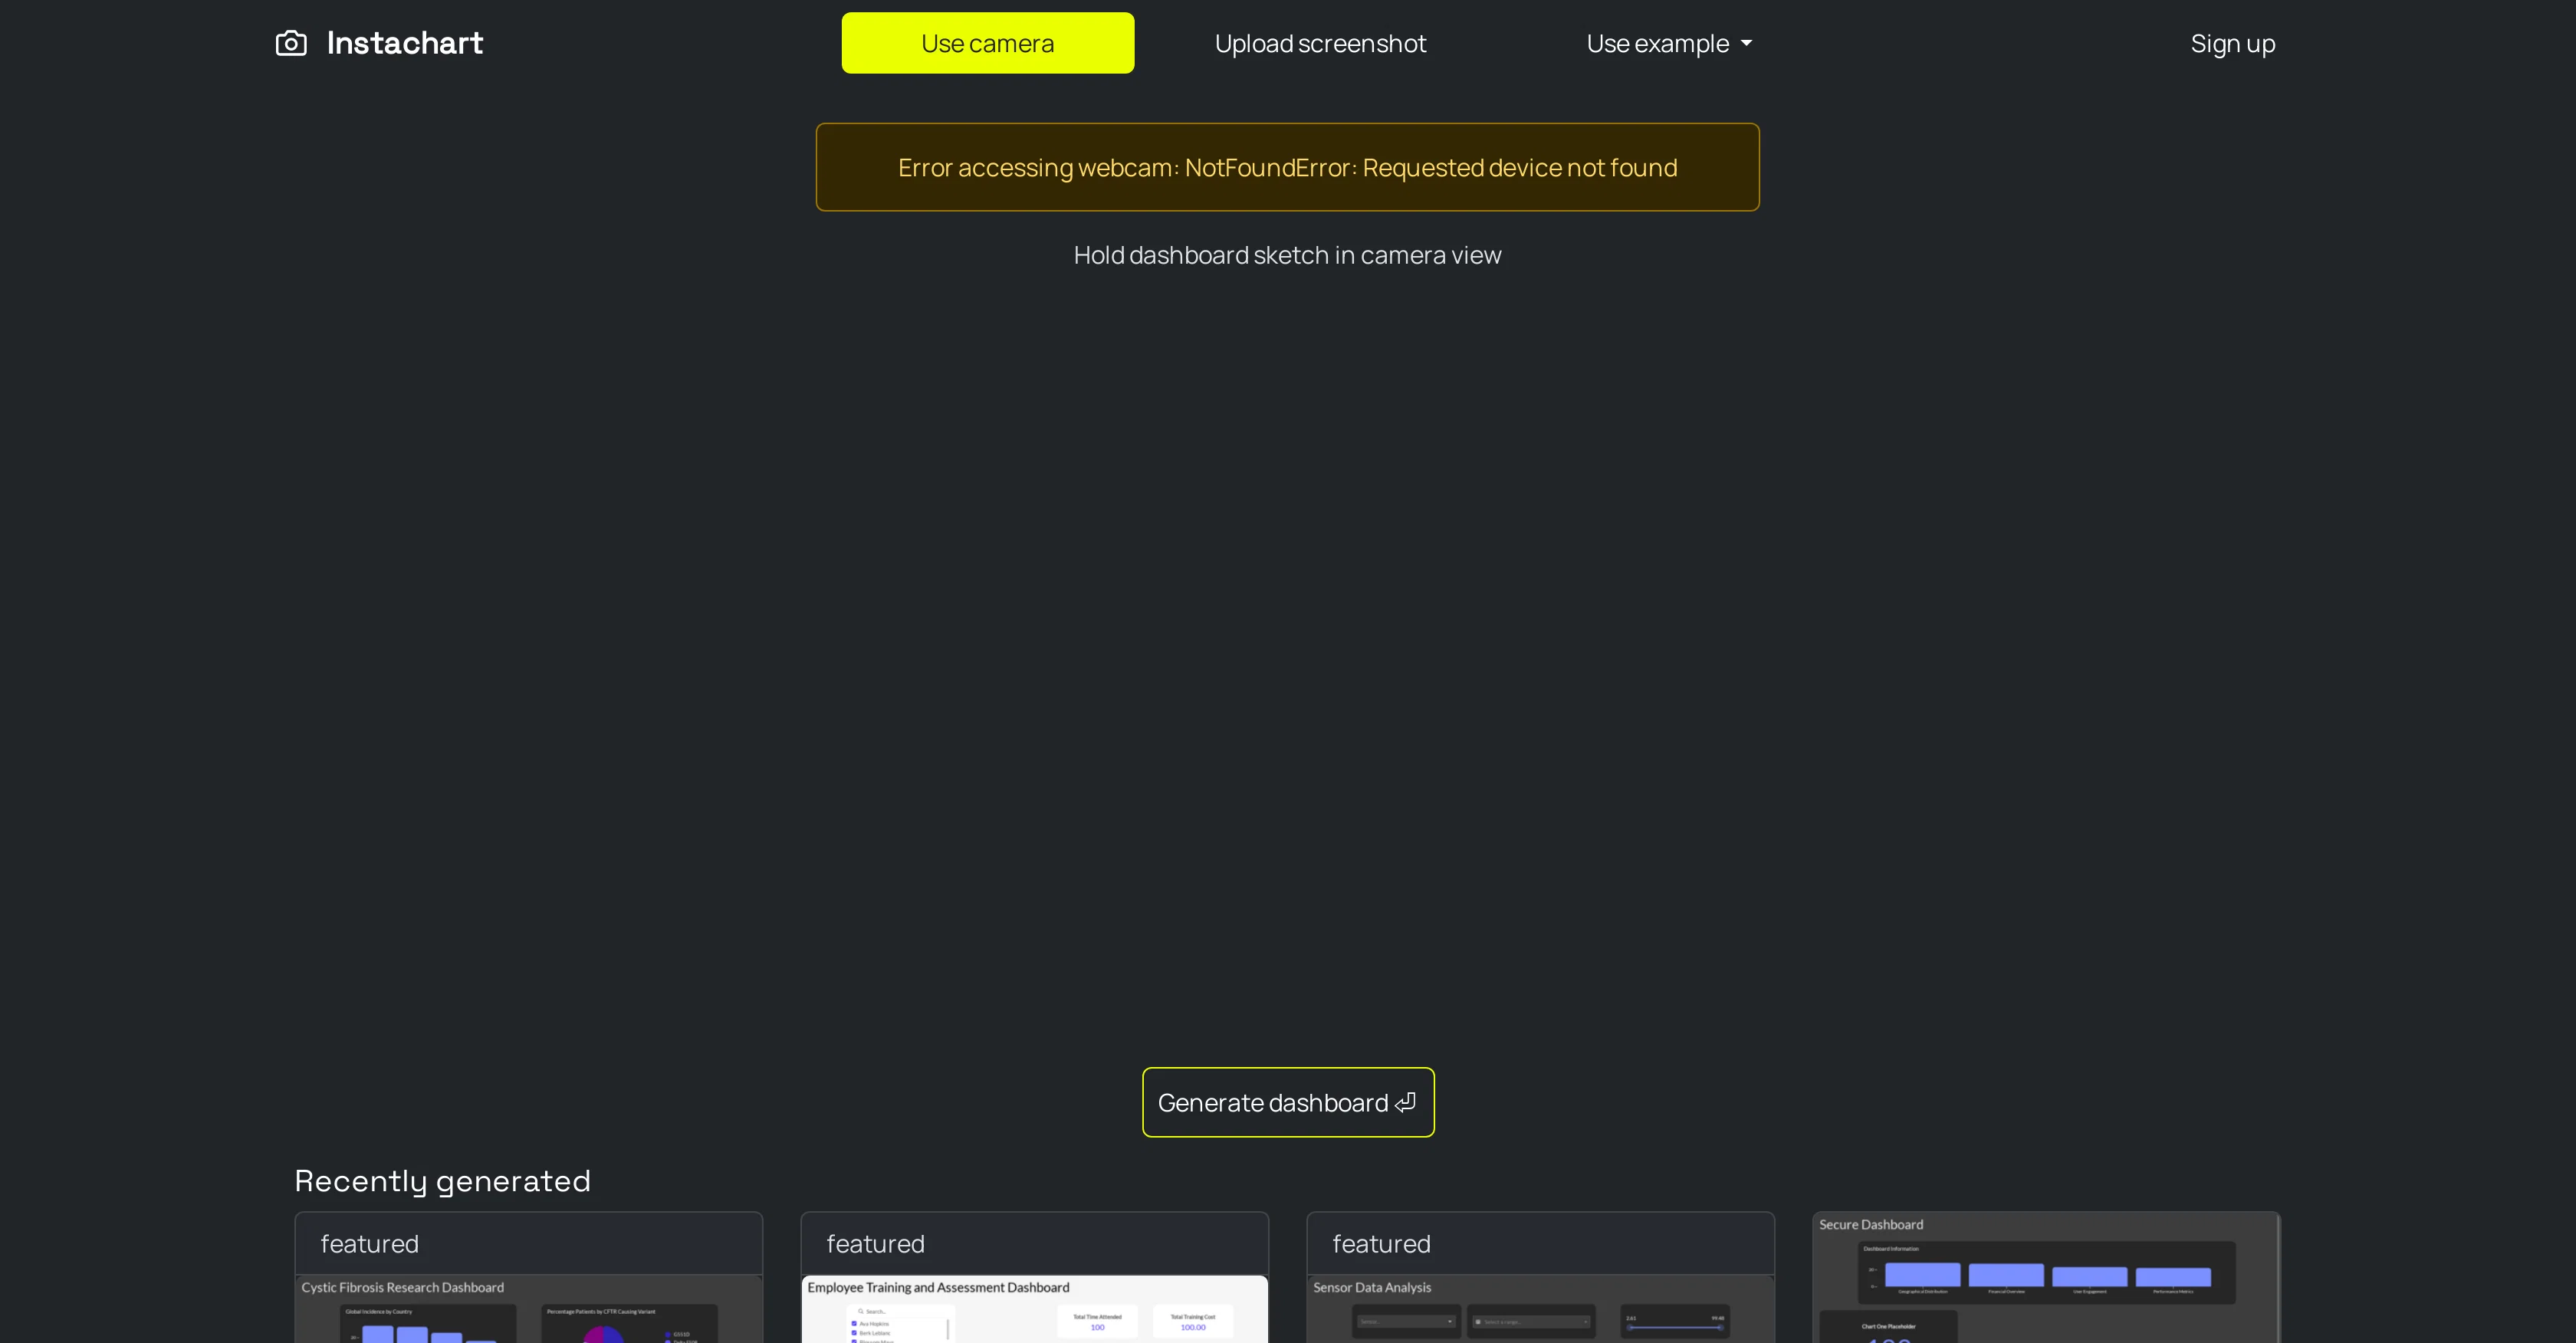
Instachart is a tool designed to quickly turn sketches, mockups, and screenshots into interactive Luzmo dashboards. It provides seamless functionality compatible with various modes of input.
Users can upload visuals or utilize the device's camera to capture sketches and images. These inputs are then transformed, generating interactive dashboards that grant more in-depth and accessible analysis of data.
This tool covers a wide range of uses as demonstrated by their featured dashboards which include, but not limited to, cystic fibrosis research, employee training and assessment, sensor data analysis, and retail sales.
Users can view these dashboards to glean insights and interpret complex data. The ease of accessibility and use make it a powerful tool for data visualization and analysis.
The tool encapsulates the essence of intuitive design and functionality, making it suitable for a diverse range of sectors and applications.
Best for
Short scenarios where Instachart tends to shine.
-
Instantly turn dashboard sketches into interactive visualizations
Example outputs 1
Sample generations and before/after results for Instachart.
Access & connections
Where you can use Instachart, and what it plugs into.
Platforms
Integrations
Capabilities
What this tool accepts, produces, and is strongest at.
Input
- Image
Output
- Text
Pros & cons
Pros
- Transforms sketches into dashboards
- Converts screenshots to dashboards
- Upload functionality for visuals
- Camera usage for inputs
- In-depth data analysis
- Accessible data interpretation
- Diverse sector application
- Used for cystic fibrosis research
Show 10 more
- Used in employee training
- Used in sensor data analysis
- Applied in retail sales
- Intuitive design
- Sign up functionality
- Feature-rich dashboards
- Interactive Luzmo dashboards
- Mocks conversion
- Multi-mode input compatibility
- Handles complex data insights
Cons
- Limited to Luzmo dashboards
- No API mentioned
- Upload visuals only
- Can't handle video inputs
- Device-specific camera usage
- No multiple dashboard types
- No real-time data
- No customization options
Compare alternatives
Similar tools in the catalog — with a clear reason to open each one.

ExcelDashboard AI ✓
Free TrialTransform Excel files into instant dashboards.
Free + from $19/mo
Full comparison
Dezbor ✓
Free TrialCreate AI-powered dashboards without code
Why look Better fit for coding
Full comparison
Superluminal ✓
Free TrialConversations & accurate answers for dashboards.
Why look Higher community rating
Full comparison
Onvo ✓
FreemiumAI-powered dashboard SDK for effortless data visualization
Why look Higher community rating
Full comparisonPeople also view
Tools that often show up alongside Instachart in collections and comparisons.
Superluminal ✓
Free TrialConversations & accurate answers for dashboards.

Stepsize AI ✓
PaidAI-powered dashboards for Jira and Linear
Onvo ✓
FreemiumAI-powered dashboard SDK for effortless data visualization
ExcelDashboard AI ✓
Free TrialTransform Excel files into instant dashboards.
Dezbor ✓
Free TrialCreate AI-powered dashboards without code

Shogo AI ✓
Free TrialTurn prompts into working visual tools instantly.

GlobalPayEX ✓
UnknownAI-powered B2B payment automation that optimizes cash flow.

Exmergo Viz ✓
FreemiumTurn messy data into beautiful dashboards in minutes.
Releases 1
FAQ 12
What is Instachart?
How does Instachart work?
What types of data can be visualized using Instachart?
How to upload visuals in Instachart?
Can I use the device's camera to input sketches into Instachart?
What applications does Instachart cover?
How does Instachart handle cystic fibrosis research data?
How can Instachart be used for employee training and assessment?
Does Instachart support sensor data analysis?
Can Instachart be used for retail sales analysis?
What makes Instachart suited for diverse sectors and applications?
How does Instachart transform sketches and screenshots into interactive dashboards?
Related tools
Recommended

DataSquirrel ✓
FreemiumData cleaning & visualization for insights gained.

GPTExcel ✓
FreemiumGenerate spreadsheet formulas with AI

Blend AI ✓
FreemiumYou favorite AI, all in one place (-20% with TAAFT at checkout)

Mindsmith ✓
FreemiumPlatform for building and sharing eLearning content

Marblism ✓
FreemiumAI Employees who Work for Your Business

Scisummary ✓
Free TrialCutting-edge scientific articles summarization.