

Vizly ✓
Analyze your Excel spreadsheet or CSV in seconds!
Trial; then from $19.99/mo
Verdict
A quick read before you dig into the full page.
- Best if
- You are researchers and need: Uncovering Healthcare Insights with AI Data Analysis
- Skip if
- You are not ready to evaluate a time boxed trial
- Pick this when
- Free Trial · Trial; then from $19.99/mo
Considering Grapha AI instead? Compare side by side
Overview


🔑 Key Features:
📂 Upload your data and analyze it in seconds
Simply upload your data files, and Vizly's AI processes and analyzes them almost instantly.
🔍 Uncover hidden insights at the press of a button
Ask questions or input prompts, and Vizly reveals patterns, trends, and insights that might otherwise remain hidden.
📊 Explore your insights with interactive visualizations
Generate over 40 interactive charts and 300 chart types to visualize your data dynamically.
🔗 Share your findings via link or export to a document
Easily share your insights with colleagues or clients by generating shareable links or exporting your analysis to various formats.
🌐 Turn your analysis into interactive, shareable web applications
Transform your data analysis into interactive web apps that anyone can access and interact with online.
📈 Interactive Charts
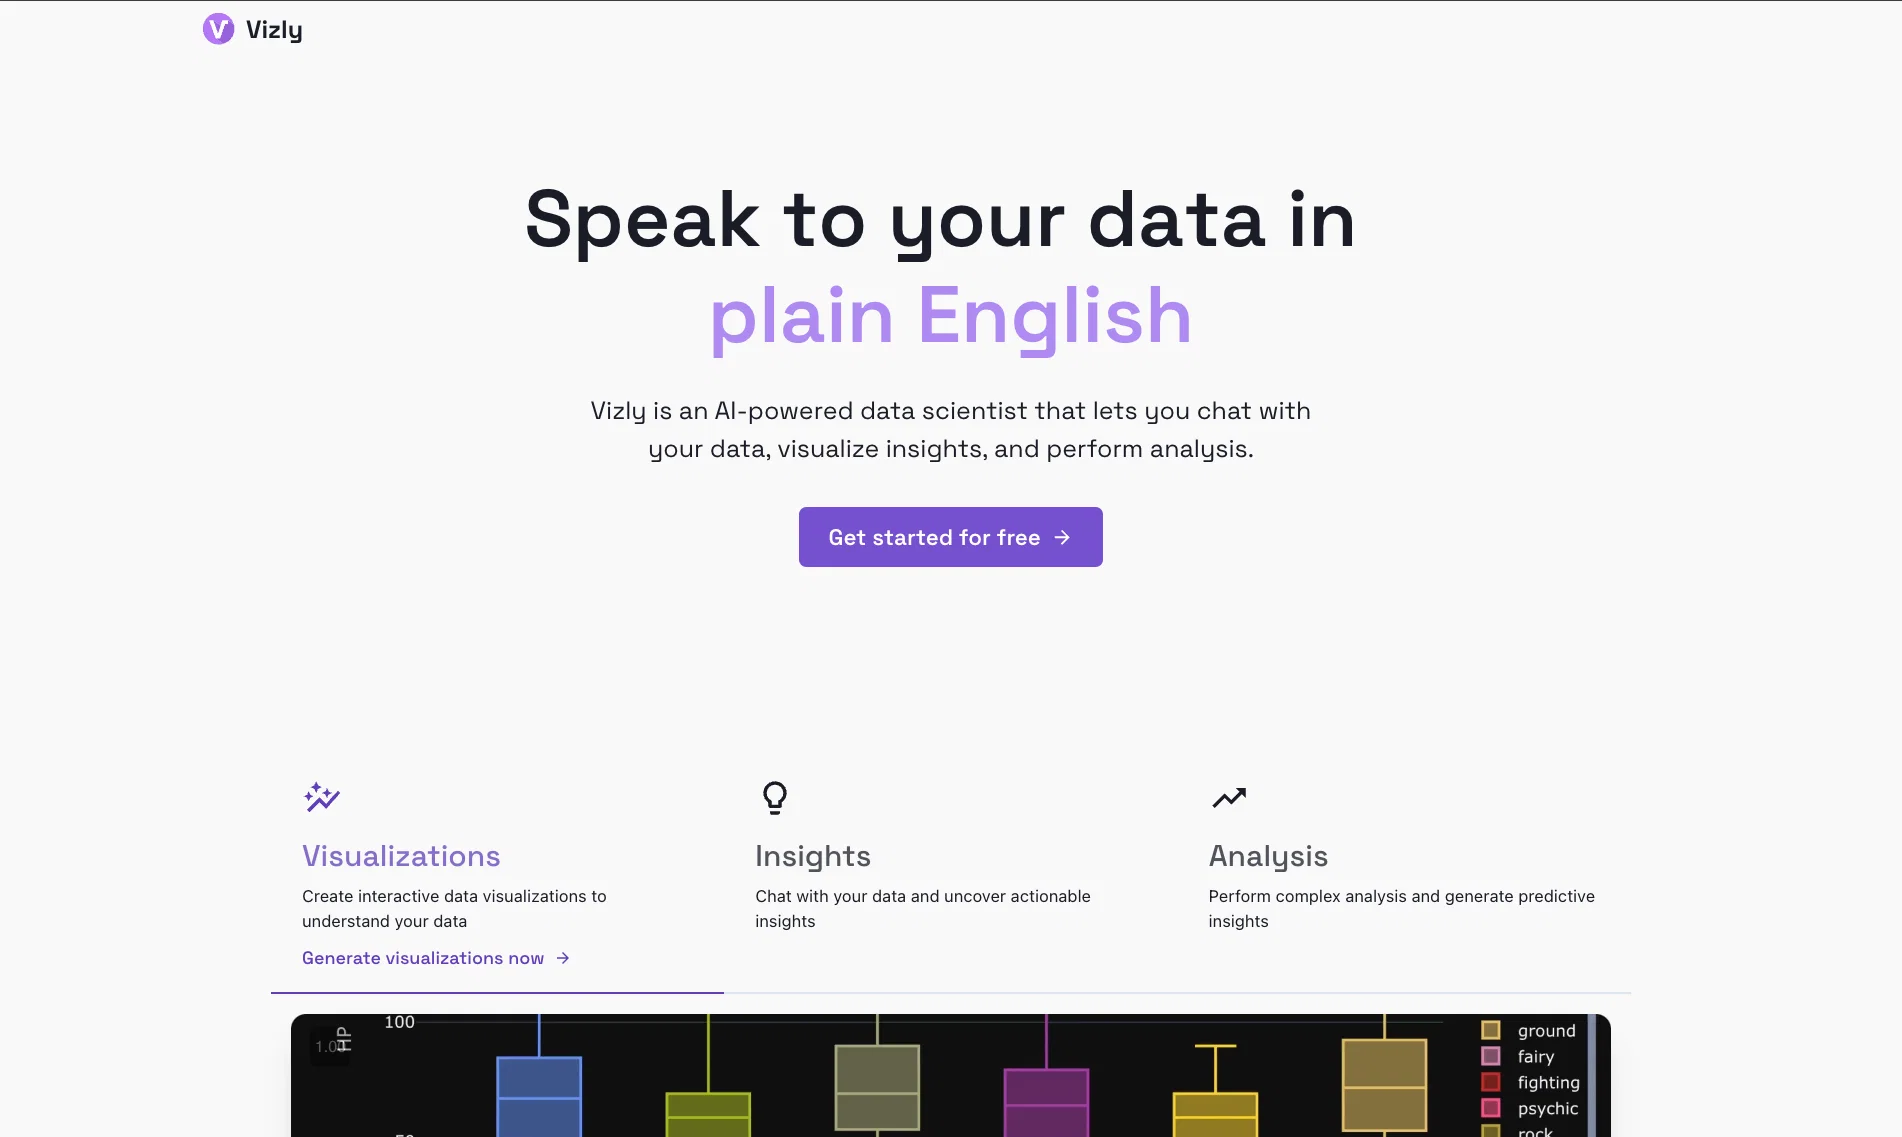
Vizly's chart AI is capable of generating a vast array of interactive charts. From basic bar charts and scatter plots to complex heat maps and geospatial visualizations, Vizly supports over 40 interactive chart categories and more than 300 specific chart types. These visualizations help you see your data from different angles, making it easier to identify key insights and trends.
🧠 Statistical Analysis
Leverage Vizly's advanced statistics AI to perform comprehensive statistical analyses without writing a single line of code. Conduct Chi-Squared tests, T-tests, ANOVA, correlation analyses, and much more. Simply ask Vizly what you want to analyze, and it handles the rest, providing you with detailed results and interpretations.
📢 Explainable Outputs
Understanding your data has never been easier. Vizly provides clear explanations for each output and piece of analysis. It guides you through interpreting results, suggests next steps, and offers concise summaries of key findings. This ensures you not only get the data but also comprehend the story it tells.
Vizly simplifies tasks that are typically performed using expensive or complicated tools like SPSS, Python, R, and Excel. By converting complex data analysis into simple prompts, Vizly makes it possible for anyone to analyze their data effectively.
➕ More
With Vizly, users can seamlessly analyze a variety of data sources, including CSV files, PDFs, images, Excel spreadsheets, JSON files, and more. Vizly doesn't just crunch numbers; it provides intelligent insights by understanding the context and nuances of your data. Need to create a report or presentation? Vizly can help generate content based on your data analysis, saving you time and ensuring accuracy.
Integration capabilities allow Vizly to work with other tools and platforms, enhancing your existing workflows and enabling seamless data transfers.
Whether you're a business analyst, researcher, student, or professional in any field that deals with data, Vizly provides an intuitive and powerful solution that saves time and enhances productivity.
😎 Related Keywords
Google Sheets, data analysis, Excel formulas, code generation, AI-powered analytics, code interpreter, interactive visualizations, statistical tests, data insights, no-code data analysis.
---
Experience the future of data analysis with Vizly—where powerful AI meets user-friendly design. Unlock your data's potential today!
Best for
Short scenarios where Vizly tends to shine.
-
Uncovering Healthcare Insights with AI Data Analysis
Best for Researchers
-
Using AI to Detect Fraudulent Financial Transactions
Best for Professors
-
Leveraging AI for Genetic Research
Best for Data analysts
-
Leveraging AI for Sociology Research
Best for Business leaders
-
Performing Exploratory Data Analysis with AI
Best for Students
-
Analyzing Google Sheets with AI
Best for Academics
Example outputs 1
Sample generations and before/after results for Vizly.
Access & connections
Where you can use Vizly, and what it plugs into.
Platforms
Integrations
Compare alternatives
Similar tools in the catalog — with a clear reason to open each one.

Grapha AI ✓
PaidUncover hidden trends and patterns in your data effortlessly.
from $150
Full comparison
DataSquirrel ✓
FreemiumData cleaning & visualization for insights gained.
Why look Typically cheaper
Full comparison
Breadcrumb ✓
FreemiumAutomate data work and reporting with AI Agents. No data|coding skills required.
Why look Better fit for coding
Full comparison
Anomaly AI ✓
FreemiumAI data analysis workspace for business datasets and reports.
Free + from $25/mo
Full comparison
ChartPixel ✓
FreemiumAI-assisted graphs and insights in 30 seconds!
Why look Typically cheaper
Full comparisonPeople also view
Tools that often show up alongside Vizly in collections and comparisons.
DataSquirrel ✓
FreemiumData cleaning & visualization for insights gained.

OpenRead ✓
FreemiumAI-powered interactive papers for faster, intuitive research

Samwell ✓
FreemiumAI-powered essay writer for faster, better results.

Elicit ✓
Free TrialAI-powered research assistant for literature reviews and analysis.

Academic Help ✓
FreemiumAutomated essay support for academic writing.

Storytell.ai ✓
FreemiumTurn your data chaos into meaningful insights
Grapha AI ✓
PaidUncover hidden trends and patterns in your data effortlessly.
Anomaly AI ✓
FreemiumAI data analysis workspace for business datasets and reports.
Releases 1
In the news
Launch coverage and community mentions for Vizly.
Imported reviews 1
I can't help but rave about this product because of the level of craftsmanship in it; Vizly is made for data scientists, by data scientists, and it shows. Having tried various tools in the space, I can confidently say it's the best by a mile, the UX is silky smooth and will feel familiar to any data scientist, and yet it manages to supercharge your workflows - I gurantee you'll be a few times more productive, can't recommend it enough.
Related tools
Recommended

Hal9 ✓
FreemiumBuild your AI-Powered Product in 30 Days

LearningStudioAI ✓
Free TrialAI-powered authoring tool for effortless online course creation.

VenturusAI ✓
FreemiumBusiness idea analysis and reporting.

GPTExcel ✓
FreemiumGenerate spreadsheet formulas with AI

MagicSlides.app AI PPT Maker ✓
FreemiumCreate Stunning PPTs in Seconds with the AI PPT Maker

Stunning ✓
PaidBuild AI-powered websites in seconds