

Grafana Assistant ✓
Monitor, analyze, and act faster with AI-powered observability.
Free + from $19/mo
Verdict
A quick read before you dig into the full page.
- Best if
- Monitor, analyze, and act faster with AI-powered observability
- Skip if
- Complex initial setup
- Pick this when
- Real-time data monitoring
Considering Traccia instead? Compare side by side
Overview
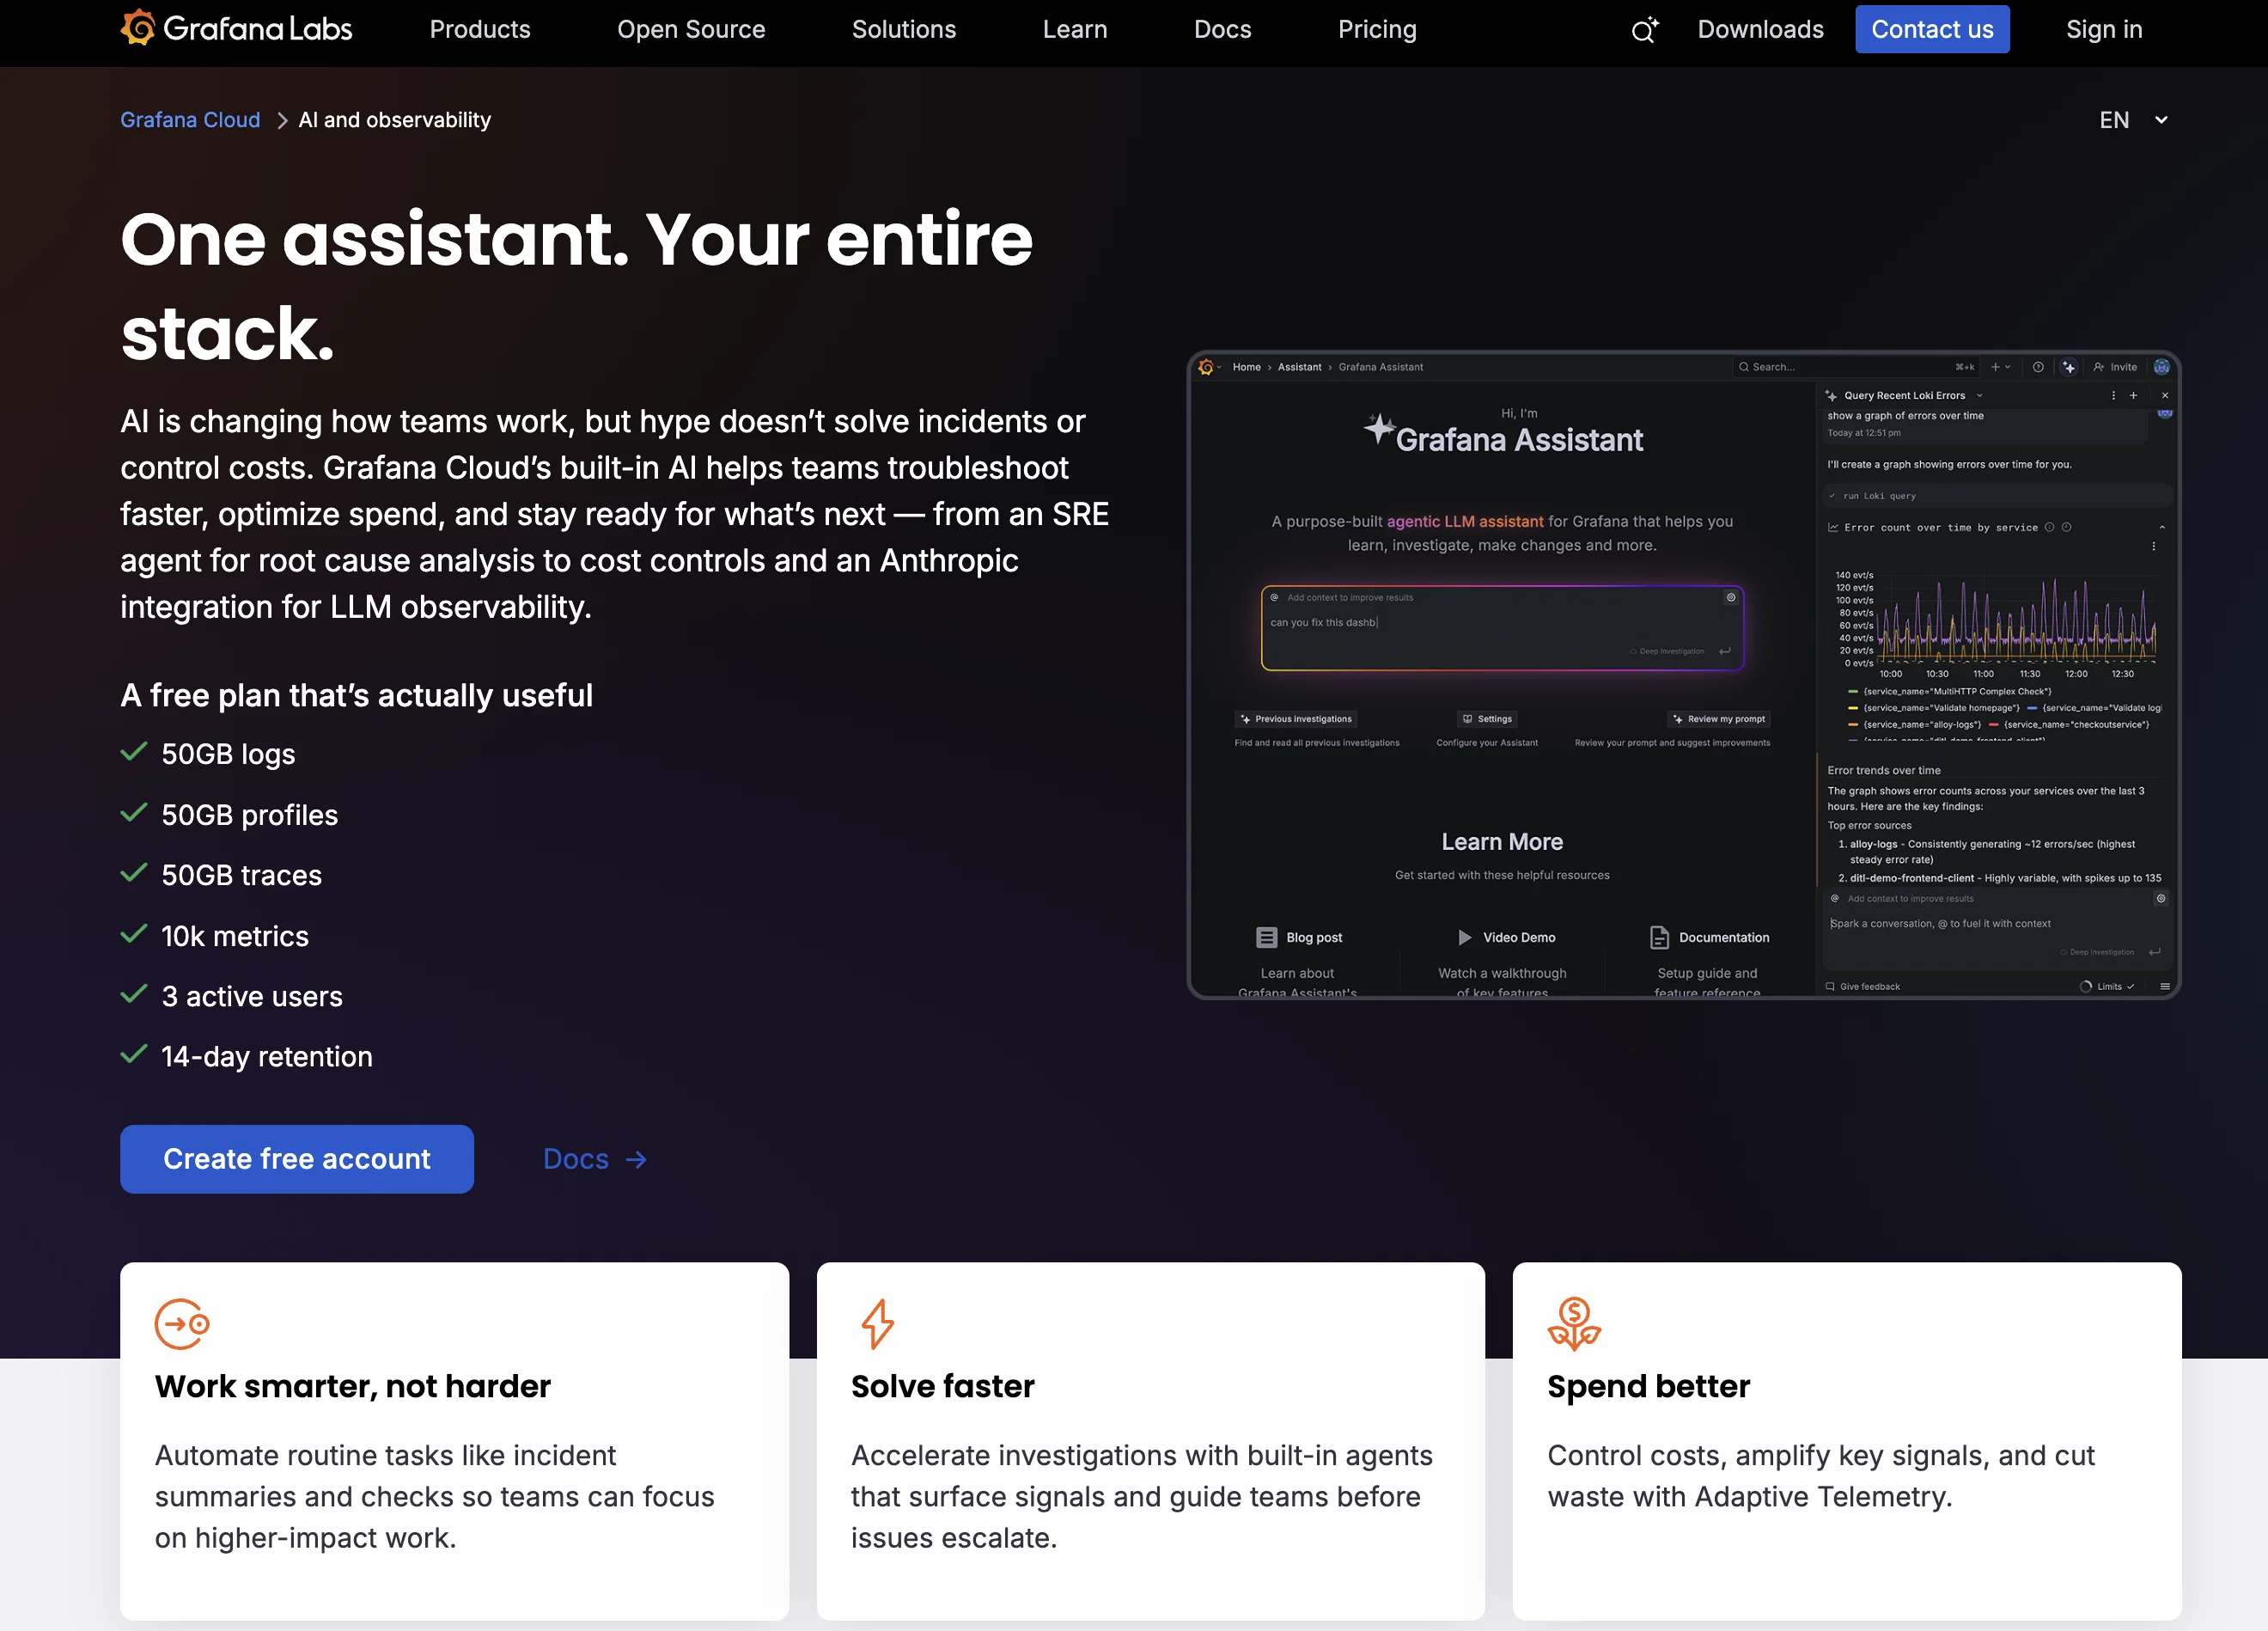
Grafana Cloud is an AI-powered observability tool designed to streamline the process of monitoring and analyzing team's data in real-time. It offers open-source solutions that enable you to monitor application performance and ensures infrastructure health.
With the provision of logging, visualization, tracing, and metrics capabilities, it helps in identifying anomalies, conducting root cause analysis, creating Service Level Objectives (SLOs), and triggering alerts.
It also offers comprehensive application performance monitoring, infrastructure observability, performance testing and synthetic monitoring. Grafana Cloud provides features for incident response and on-call management, automating routine tasks and ushering in flexible management during incidents.
Its solutions are designed to include monitoring integrations with technologies such as Linux, Windows, Docker, PostgreSQL, MySQL, AWS, Kafka, Jenkins, RabbitMQ, MongoDB, Microsoft Azure, and Google Cloud.
The platform supports a wide array of data sources and offers visualization integrations with MongoDB, AppDynamics, Oracle, GitLab, Jira, Salesforce, Splunk, Datadog, New Relic, and Snowflake among others.
Committed to enhancing the ease and speed of onboarding and minimizing vendor lock-in, it aims to help teams work smarter across the observability journey.
Access & connections
Where you can use Grafana Assistant, and what it plugs into.
Platforms
Integrations
Capabilities
What this tool accepts, produces, and is strongest at.
Input
- API
Output
- API
Pros & cons
Pros
- Real-time data monitoring
- Open-source solutions
- Metrics capabilities
- Logging and visualization
- Anomaly identification
- Root cause analysis
- Service level objectives
- Automated alert triggering
Show 33 more
- Application performance monitoring
- Infrastructure health observer
- Performance testing
- Synthetic monitoring
- Incident response features
- On-call management
- Task automation during incidents
- Flexible incident management
- Linux Integration
- Windows Integration
- Docker Integration
- PostgreSQL Integration
- MySQL Integration
- AWS Integration
- Kafka Integration
- Jenkins Integration
- RabbitMQ Integration
- MongoDB Integration
- Microsoft Azure Integration
- Google Cloud Integration
- Wide data source support
- MongoDB Visualization
- AppDynamics Integration
- Oracle Integration
- GitLab Integration
- Jira Integration
- Salesforce Integration
- Splunk Integration
- Datadog Integration
- New Relic Integration
- Snowflake Integration
- Easy and fast onboarding
- Minimizes vendor lock-in
Cons
- Complex initial setup
- Requires in-depth technical skills
- No integration with legacy systems
- Lacks advanced security features
- Vendor lock-in policy unclear
- Performance testing limitations
- Limited service-level objective customization
- Inefficient alert triggering system
Show 2 more
- No support for custom data sources
- Limited user access control
Compare alternatives
Similar tools in the catalog — with a clear reason to open each one.

Traccia ✓
FreemiumFinally ! A vendor neutral - AI Agent Control Plane - Observe,Evaluate,Govern&Audit
Free + from $99.00/mo
Full comparison
Langfuse ✓
FreemiumTrace, evaluate, and improve AI agents with one open platform.
Free + from $29/mo
Full comparison
Braintrust ✓
FreemiumAI observability platform for building quality AI products.
Free + from $249/mo
Full comparison
New Relic ✓
Free TrialAI-powered observability platform that predicts and prevents issues.
Why look Typically cheaper
Full comparison
Datadog ✓
FreemiumSee inside any stack, any app, anywhere.
Why look Typically cheaper
Full comparisonReleases 1
FAQ 12
What is Grafana Cloud's main functionality?
What AI capabilities does Grafana Cloud have?
Does Grafana Cloud offer real-time monitoring?
How does Grafana Cloud help in identifying anomalies?
What tools does Grafana Cloud provide for root cause analysis?
What are the capabilities of Grafana Cloud in terms of incident response and on-call management?
Which technologies does Grafana Cloud integrate with for monitoring?
What databases does Grafana Cloud support?
Does Grafana Cloud offer visualization integrations?
How does Grafana Cloud help in onboarding and vendor lock-in minimization?
What testing options are provided by Grafana Cloud?
How can Grafana Cloud aid in streamlining team's data analysis?
Related tools
Recommended

Modelence ✓
FreemiumBuild production-ready web apps with AI.

FastRouter ✓
Free TrialLightning Fast LLM Gateway

Support Flow ✓
FreemiumAI assistant that proactively surfaces the best technical content, data, and actions.

Flutch ✓
FreemiumAI sales infrastructure for service businesses

AI Visibility Rank ✓
FreemiumSee how your brand appears in AI answers.
Search-Visibility.AI ✓
FreemiumTrack your brand visibility across AI models.