

Revenue analysis 2026 Rank: #1243
Chartsy ✓
AI-powered SaaS analytics for Stripe & Paddle
Verdict
A quick read before you dig into the full page.
- Best if
- AI-powered SaaS analytics for Stripe & Paddle
- Skip if
- Not suitable for non-subscription businesses
- Pick this when
- Customizable analytics dashboard
Considering Tinkery instead? Compare side by side
Overview


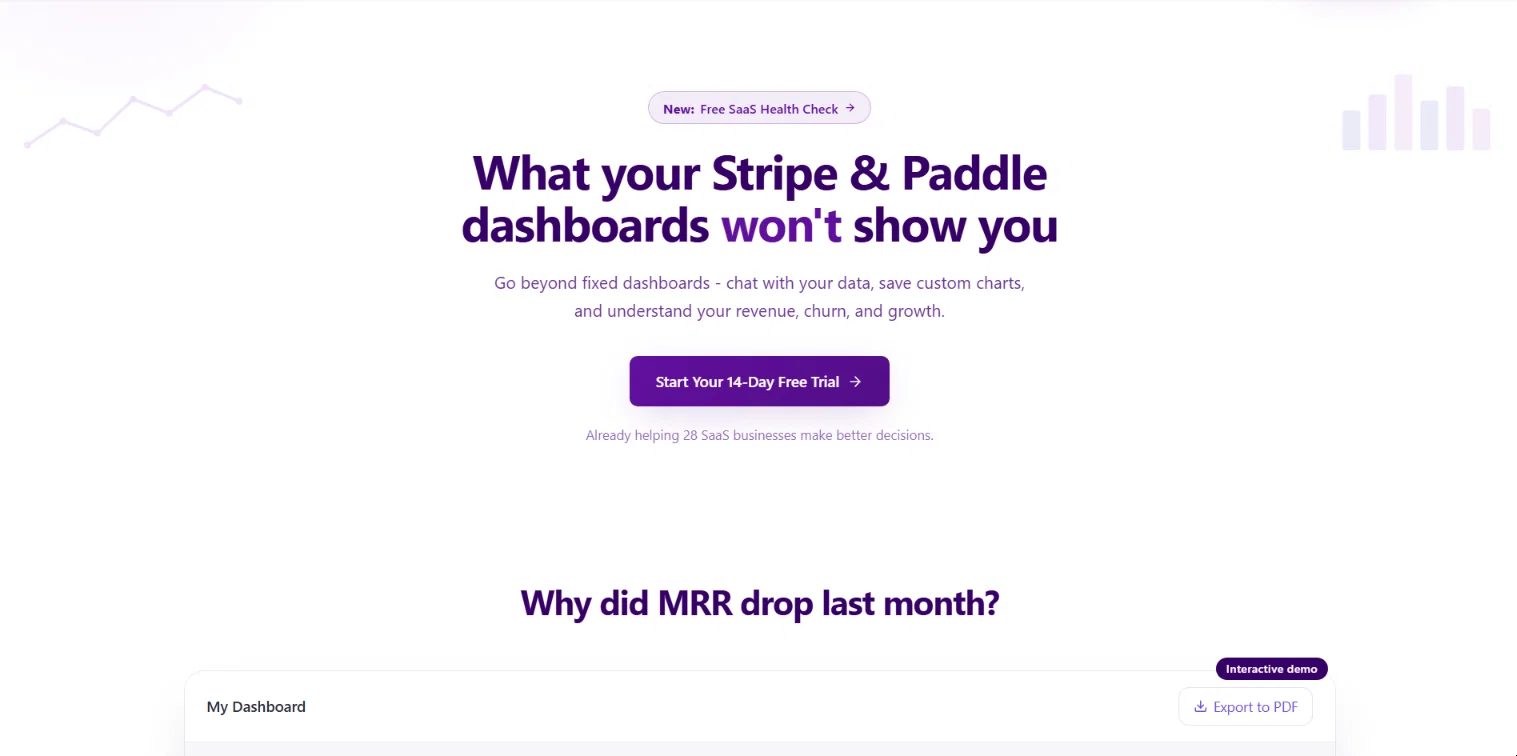
By connecting Stripe or Paddle, businesses instantly get access to pre-built analytics dashboards for MRR, ARR, churn, retention, LTV, failed payments, refunds, subscription growth, and plan performance. One of Chartsy’s core features is its dedicated MRR dashboard breakdown, which helps businesses clearly understand how recurring revenue changes over time through upgrades, downgrades, new subscriptions, churn, reactivations, and expansion revenue.
Chartsy also includes metadata analytics, allowing teams to analyze custom Stripe or Paddle metadata and uncover patterns across customer types, plans, locations, acquisition channels, internal tags, and any other custom business-specific data associated with subscriptions and payments.
The platform’s built-in AI analytics engine allows users to ask personalized questions about their own data in plain English. Instead of filtering spreadsheets or writing SQL queries, users can ask questions like:
• “Why did churn increase this month?”
• “Which customers generate the highest revenue?”
• “Show me expansion revenue trends.”
• “What changed in MRR compared to last quarter?”
Chartsy then generates instant charts, graphs, and explanations directly from the connected subscription data.
Features include:
• Dedicated MRR dashboard breakdown
• Metadata analytics for custom business data
• AI-powered subscription analytics
• Plain English data exploration
• AI-generated charts and visualizations
• Pre-built dashboards for SaaS metrics
• MRR, ARR, churn, retention, and LTV tracking
• Revenue, refund, and failed payment analytics
• Subscription plan performance insights
• Fully customizable dashboards
• Scheduled email reports
• Exportable PNG and PDF visualizations
• Stripe and Paddle integrations
• No SQL or technical expertise required
Chartsy is built for SaaS founders and teams who want to understand their business faster, ask deeper questions about their data, and move beyond static analytics dashboards.
- Customizable Dashboards With The Insights You Need Not The Ones You Select From Predefined Dashboards
- Chat With Your Data
- Chat With Your Data And Get The Results As Charts And Graphs
- All-in-one Dashboard
- Private And Secure: Your Data Is Never Used For Training
- Daily Briefing Of Your Metrics And What Changed, As A Message On Chartsyai Chatbot
- Design All Kinds Of Dashboards, Even The Ones For Investors
- Create Your Dashboard, Export As Pdf
- Weekly Reports Of Most Important Saas Metrics
- Metadata Analytics
- Use Your Metadata And Analyze Them Instead Of Just Saving Them To Your Stripe Or Paddle
- Subscription Analytics For Stripe And Paddle Accounts
- Multiple Stripe And Paddle Accounts
Access & connections
Where you can use Chartsy, and what it plugs into.
Platforms
Integrations
Capabilities
What this tool accepts, produces, and is strongest at.
Input
- Tabular
- Text
Output
- Tabular
- Text
- Image
Highlights
- SOTA
Models
Text
Image
Audio
Video
Coding
Pros & cons
Pros
- Customizable analytics dashboard
- Natural language data queries
- Automated data analysis
- Calculates desired metrics
- Auto-selection of visualizations
- Tracks fundamental SaaS metrics
- Produces financial reports
- Stripe and Paddle integration
Show 32 more
- Built-in templates
- Chat assistant for data
- Metadata and revenue analytics
- E-commerce analytics
- Real-time insights
- Export & share feature
- Customizable dashboards
- Team collaboration feature
- Secure one-click integrations
- Supports BigCommerce analytics
- Real-time data sync
- Subscription metrics & insights
- Product & revenue analytics
- Real-time sales tracking
- Track revenue trends
- Average order value analytics
- Customer behavior analytics
- SaaS and e-commerce integrations
- No SQL or formulas
- Instant intelligent visualizations
- Downloadable reports as PDFs
- Exportable charts as PNGs
- Seamlessly connect with Paddle
- No rigid templates
- Live sharing of dashboards
- Supports multiple integrations
- Boardroom-ready visualizations
- Track MRR, churn, subscription
- Track products, revenue trends
- Secure API connection
- More e-commerce integrations coming
- Transforms payment data
Cons
- Limited integration options
- No API mentioned
- Limited to SaaS businesses
- Lack of coding interface
- No offline mode
- No direct SQL queries
- Not suitable for non-subscription businesses
- Missing multi-language support
Show 1 more
- No multi-platform support
Compare alternatives
Similar tools in the catalog.




Releases 1
Imported reviews 1
Great product overall. The dashboards are clean, and chatting with the data is a huge time saver. One improvement I'd love to see is more detailed AI explanations with the supporting data, so it's easier to understand why a metric changed. Looking forward to future updates!
FAQ 12
What is Chartsy?
What are the key features of Chartsy?
How can Chartsy help SaaS businesses?
How does Chartsy integrate with Stripe and Paddle?
Can I customize my analytics dashboard in Chartsy?
What are the natural language queries in Chartsy?
How does Chartsy track monthly recurring revenue (MRR)?
What type of data can Chartsy visualize?
Can Chartsy produce financial reports for stakeholders?
Does Chartsy requires coding knowledge to operate?
How does Chartsy automate data analysis tasks?
What is Chartsy's chat assistant feature?
Related tools
Recommended

GetLogit ✓
FreemiumArtificial intelligence, available for everyone.

ChatGPT ✓
FreemiumAsk anything, create anything, and move from idea to action.

Notis ✓
Free TrialThe first WhatsApp assistant that runs on your ChatGPT and Claude subscriptions

freebeat AI ✓
FreemiumTurn Music & Ideas into Viral Videos In One Click

Jason AI ✓
PaidAI-powered assistant for B2B sales outreach

DeepSeek ✓
FreeUnravel the mystery of AGI with curiosity