RunStocks
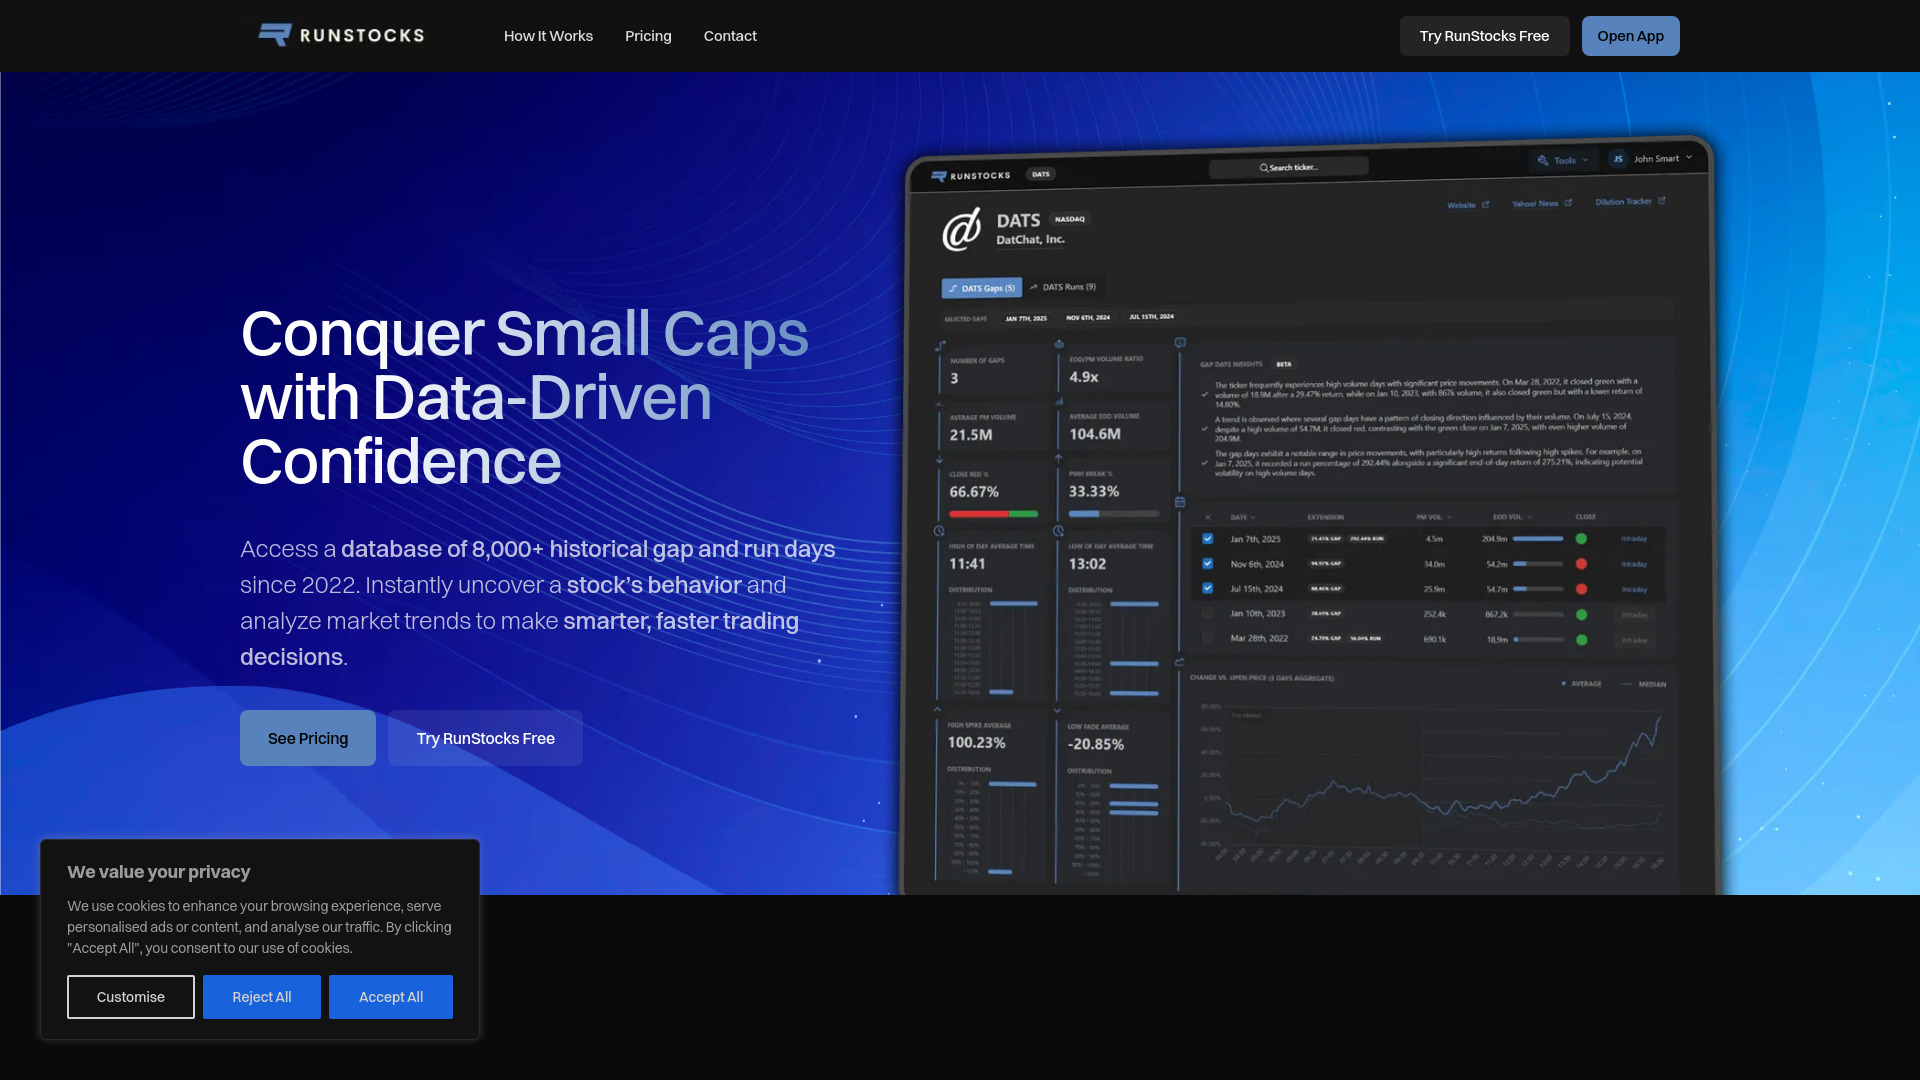
RunStocks analyzes small-cap stocks' historical data to help day traders make informed decisions.
Free + from $25 / mo. ($13.75 / mo. with LAUNCH45 promo code for the first year)
Verdict
A quick read before you dig into the full page.
- Best if
- RunStocks analyzes small-cap stocks' historical data to help day traders make informed decisions
- Skip if
- You need enterprise SLAs or a fully managed team plan right away
- Pick this when
- Freemium · Free + from $25 / mo. ($13.75 / mo. with LAUNCH45 promo code for the first year)
Overview
RunStocks is a powerful analytics platform designed for small-cap day traders. It helps day traders uncover the true character of small-cap stocks by analyzing historical gap and run behavior, price action trends, and key performance insights since 2022. It provides detailed historical data on stocks that have experienced gaps of 20% or more and runs of 50% or more. By analyzing price action, volume trends, and post-gap behavior, traders can identify high-probability setups and refine their strategies with data-driven insights.
Access & connections
Where you can use RunStocks, and what it plugs into.
Platforms
Integrations
Capabilities
What this tool accepts, produces, and is strongest at.
Highlights
- Stock-Specific Character Analysis
- Intraday Price Action Analysis
- Daily Adjustments for Reverse Splits
- Comprehensive Historical Data
- Mobile-Optimized for On-the-Go Trading
- Detailed Performance Metrics
- Market Trend Monitoring
- End-Of-Day Calendar of Gaps & Runs
Show 2 more
- Fundamental Data at Your Fingertips
- AI-Enhanced Insights
FAQ 12
What is RunStocks?
How to use RunStocks?
What does RunStocks do?
Who is RunStocks for?
What is a gap? What is a run?
How accurate is RunStocks data?
Can RunStocks integrate with existing tools?
Is RunStocks easy to use if you’re not technical?
How often is RunStocks data updated?
Does RunStocks cover all stocks?
Can I use RunStocks for swing trading?
Is there a free access?
- Ticker-specific gap and run data is available only for the last 4 months.
- Market-wide analysis (aggregated trends across multiple tickers) is limited to the last 7 days.
A full subscription unlocks the entire historical dataset (since 2022), allowing for deeper analysis and better insights into past market behaviors.