
CalcGen AI
AI-powered platform for creating interactive charts, graphs, calculators, and data visualizations.
Source rating 5.0
(64)
2.7k views
2.7k/mo traffic
0 saves
Unknown
Verdict
A quick read before you dig into the full page.
- Best if
- AI-powered platform for creating interactive charts, graphs, calculators, and data visualizations
- Pick this when
- AI-powered platform for creating interactive charts, graphs, calculators, and data visualizations
Overview
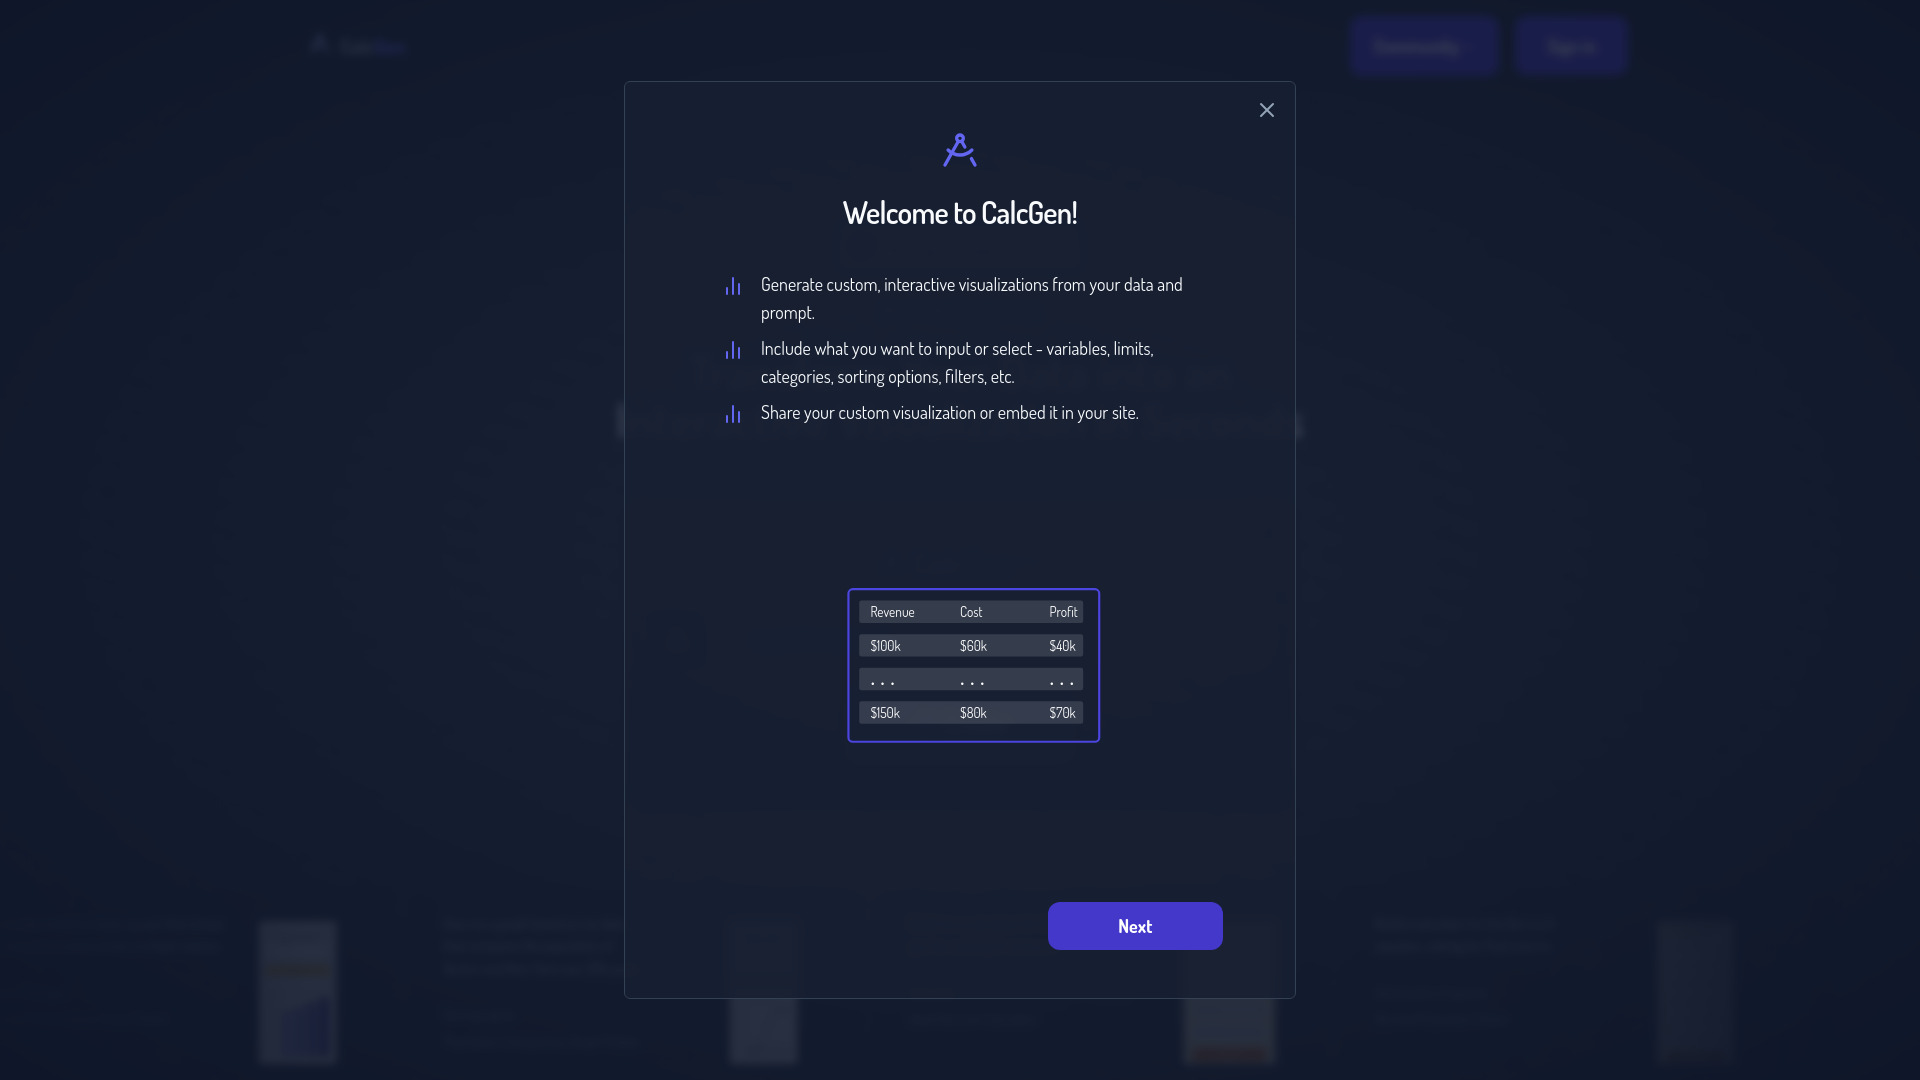
CalcGen AI is a platform designed to create interactive charts, graphs, calculators, and data visualizations effortlessly using AI. It allows users to generate custom visualizations from their data and prompts, including options to input variables, limits, categories, sorting options, and filters. Users can share or embed these visualizations on their websites. CalcGen AI supports various data inputs, enhancing data storytelling and insights for businesses and educators.
Access & connections
Where you can use CalcGen AI.
Platforms
Capabilities
What this tool accepts, produces, and is strongest at.
Highlights
- AI-powered chart, graph, and calculator generation
- Interactive and customizable visualizations
- Data visualization from various data inputs
- Embedding options for websites
- Data storytelling and insights enhancement
FAQ 5
What is CalcGen AI?
CalcGen AI is a platform designed to create interactive charts, graphs, calculators, and data visualizations effortlessly using AI. It allows users to generate custom visualizations from their data and prompts, including options to input variables, limits, categories, sorting options, and filters. Users can share or embed these visualizations on their websites. CalcGen AI supports various data inputs, enhancing data storytelling and insights for businesses and educators.
How to use CalcGen AI?
Users can upload data tables or describe the desired plot, graph, or calculator. The AI agent will then generate the interactive visualization based on the provided data and specifications. Users can customize inputs and selections, and then share or embed the visualization.
What can CalcGen AI create?
CalcGen AI can create interactive charts, graphs, calculators, and data visualizations from various data inputs.
How do I use CalcGen AI?
You can upload images and data tables or describe what you want plotted. The AI will generate the visualization, which you can then customize and embed.
What are some examples of visualizations I can create?
Examples include financial performance graphs, population comparison graphs, ideal gas law calculators, roofing quote generators, and more.
Related tools
Recommended
CalcGen AI