AI graph maker
AI-powered tool to create stunning data visualizations effortlessly and quickly.
Free + from $4 per month
Verdict
A quick read before you dig into the full page.
- Best if
- You are data analysts and need: Visualizing sales data by quarter using a bar chart
- Skip if
- You need enterprise SLAs or a fully managed team plan right away
- Pick this when
- Freemium · Free + from $4 per month
Overview
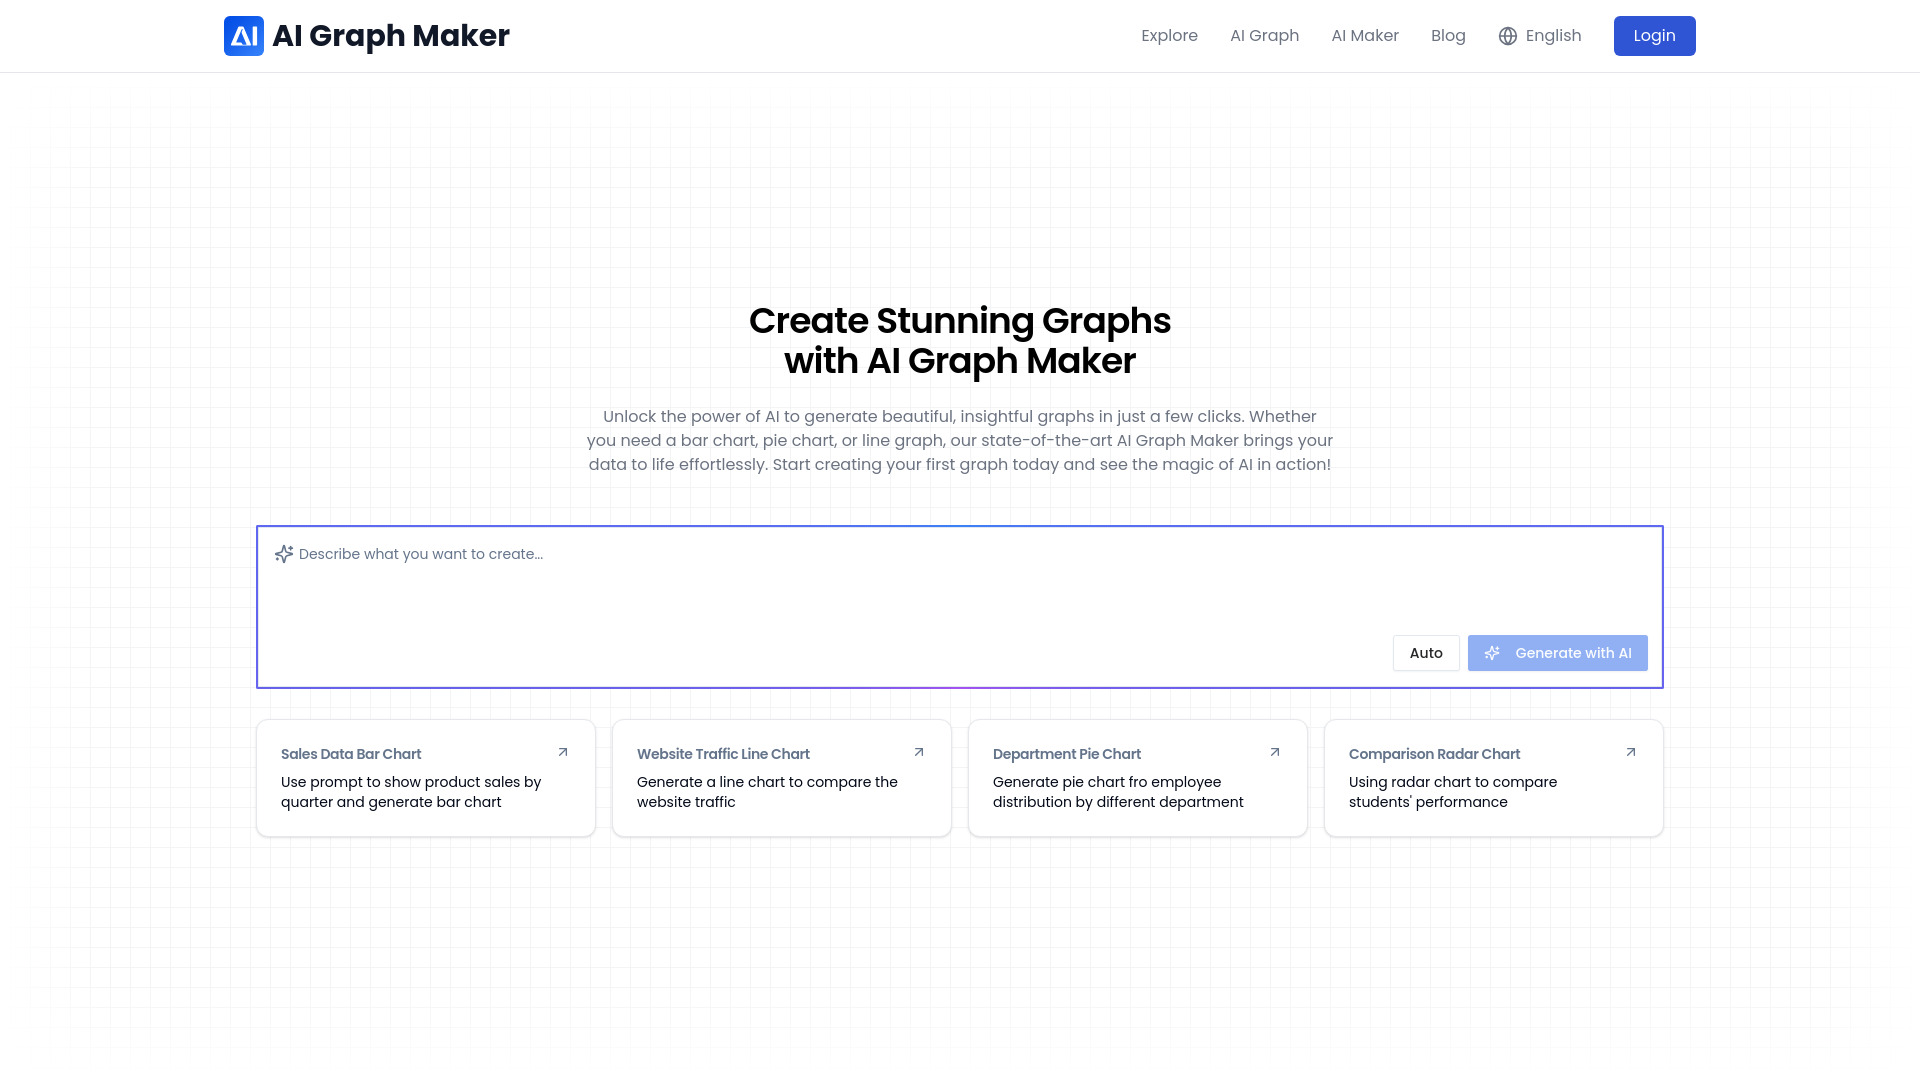
AI Graph Maker is an AI-powered tool that transforms data into stunning visualizations effortlessly. It allows users to create charts, graphs, and diagrams in minutes. The tool supports various chart types, including bar charts, line charts, flowcharts, pie charts, scatter plots, and more. It is designed for both professionals and beginners, offering a user-friendly interface and flexible editing and export options.
Best for
Short scenarios where AI graph maker tends to shine.
-
Visualizing sales data by quarter using a bar chart
Best for Data analysts
-
Comparing website traffic with a line chart
Best for Project managers
-
Showing employee distribution by department with a pie chart
Best for Business professionals
-
Comparing students' performance using a radar chart
Best for Educators
-
Project management, personal planning, historical tracking, or event planning using timelines
Best for Marketers
-
Planning tasks, tracking progress, and optimizing resource allocation using Gantt charts
Best for Researchers
-
Representing the steps of a process or task using flowcharts
Best for Data analysts
Example outputs 1
Sample generations and before/after results for AI graph maker.
Access & connections
Where you can use AI graph maker.
Platforms
Capabilities
What this tool accepts, produces, and is strongest at.
Highlights
- AI-powered graph generation
- Multiple chart types support
- Flexible editing and customization
- Multi-format export (PNG, SVG, Mermaid)
- Responsive design for all devices
People also view
Tools that often show up alongside AI graph maker in collections and comparisons.